")
")
Fig. 6
Download original image
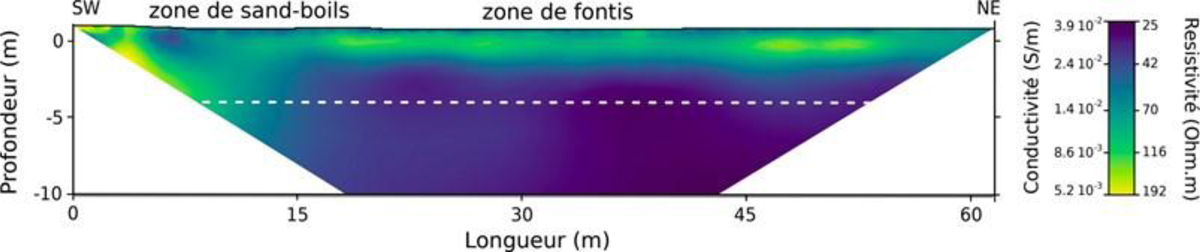
Résultats ERT le long de L3, conductivité et résistivité du sol (Girolami et al., 2023). La position de la nappe phréatique au moment des mesures est représentée en pointillé (−5 m).
ERT results along L3, soil conductivity and resistivity (Girolami et al., 2023). The position of the water table at the time of measurements is represented by the dotted line (−5m).
Current usage metrics show cumulative count of Article Views (full-text article views including HTML views, PDF and ePub downloads, according to the available data) and Abstracts Views on Vision4Press platform.
Data correspond to usage on the plateform after 2015. The current usage metrics is available 48-96 hours after online publication and is updated daily on week days.
Initial download of the metrics may take a while.