")
")
| Issue |
Rev. Fr. Geotech.
Number 177, 2023
Hommage à Pierre Bérest
|
|
|---|---|---|
| Article Number | 1 | |
| Number of page(s) | 8 | |
| DOI | https://doi.org/10.1051/geotech/2024017 | |
| Published online | 11 avril 2024 | |
Research Article
Rock salt creep: a cross-check test to cover the full relevant range of deviatoric stresses
Fluage du sel gemme : un essai de vérification pour étendre la gamme des contraintes déviatoriques adaptée aux applications souterraines
1
Centre de Géosciences, Mines Paris, Université PSL, Fontainebleau, France
2
Laboratoire de Mécanique des Solides, École Polytechnique, Palaiseau, France
3
Laboratoire Navier, École des Ponts, Université Gustave Eiffel, CNRS UMR 8205, Champs-sur-Marne, France
4
Brouard Consulting, Paris, France
* Corresponding author: Cette adresse e-mail est protégée contre les robots spammeurs. Vous devez activer le JavaScript pour la visualiser.
Abstract
The time-dependent response of rock salt has been mainly investigated using confined creep tests covering a differential stress range between 5 and 20 MPa. In recent years, efforts have been made to investigate the range 0.1–4.5 MPa, using dead-end drifts in underground mines to take advantage of the very stable ambient conditions (temperature, relative humidity). Up to now, the combination of experimental data in the two ranges is difficult because of the use of different salt facies, sample preparation methods, test temperatures and experimental conditions (e.g., confined vs. unconfined tests, scale of measurements). In this work, we conduct two long-term creep tests on two natural salt samples from the same origin and prepared using the same protocol. The thermo-mechanical loading path is the same for the two tests, with only a small difference in the lateral load. One test is performed in a remote drift in a salt mine and the other test is performed in a climatic chamber in the laboratory. The comparison of the results is consistent, allowing to investigate a large range of deviatoric stresses by combining results in the two facilities. The final goal of this approach is to reduce stress extrapolation by investigating the whole deviatoric range that is relevant for underground operations. Next steps include investigating in more detail the effect of intergranular fluids, testing different temperatures and performing confined tests in the mine.
Résumé
Le comportement à long-terme du sel gemme a été principalement étudié moyennant des essais de fluage confinés et couvrant une gamme de contraintes déviatoriques entre 5 et 20 MPa. Récemment, des efforts ont été menés pour étudier la gamme 0,1–4,5 MPa, en utilisant des galeries reculées dans des mines souterraines pour profiter des conditions ambiantes très stables (température, humidité relative). Jusqu’à présent, la combinaison des données expérimentales obtenues dans les deux gammes s’avère difficile en raison de l’utilisation de faciès de roche, de méthodes de préparation des échantillons, de températures et de conditions expérimentales différentes (e.g., essais confinés ou uniaxiaux, échelle des mesures). Dans ce travail, on présente deux essais de fluage très longs sur deux échantillons de sel naturel provenant de la même origine géographique et préparés selon le même protocole. Le chemin de charge thermomécanique est le même dans les deux essais, avec seulement une faible différence dans la pression latérale. L’un des essais est réalisé dans une galerie reculée d’une mine de sel et l’autre dans une chambre climatique en laboratoire. La comparaison des résultats est cohérente, ce qui permet d’étudier une large gamme de contraintes déviatoriques en combinant les résultats obtenus dans les deux installations. L’objectif final de cette étude est de réduire l’extrapolation des contraintes en étudiant l’ensemble de la gamme qui est pertinente pour les ouvrages souterrains. Les principales perspectives sont l’étude plus approfondie de l’effet des fluides intergranulaires, la réalisation des essais à différentes températures et la réalisation d’essais confinés dans la mine.
Key words: rock salt / long-term creep / extrapolation reduction / mine tests / laboratory tests / low differential stresses
Mots clés : sel gemme / comportement à long terme / réduction de l’extrapolation / essais en mine / essais en laboratoire / faibles contraintes déviatoriques
© CFMS-CFGI-CFMR-CFG, 2023
1 Introduction
Rock salt has been used for several decades as a host rock for underground storage and disposal. Apart from its compelling hydraulic and thermal properties, rock salt is interesting from the mechanical perspective due to several reasons, in particular its self-healing potential, its work hardening and ductility, and its time-dependent response. Up to recently, the time-dependent behavior of rock salt has mainly been investigated by means of creep tests performed under differential stresses in the range 5–20 MPa, which is representative of the stress state around underground openings (DeVries, 1988; Herchen et al., 2018; Lüdeling et al., 2022). However, beyond the distance of influence of the excavations, the host rock is subjected to deviatoric stresses which, assuming an initially isotropic state of stress, are much smaller than 5 MPa (in fact, close to zero). Consequently, the behavior of the vast majority of the rock salt volume around excavations has not been properly investigated at the laboratory scale, and in current engineering practice, the response observed at the laboratory in the range 5–20 MPa (and different temperatures) is extrapolated towards lower differential stresses when underground infrastructures are analyzed. This, in turn, is delicate, as most constitutive models used in engineering are phenomenological, and should therefore avoid extrapolations (Paterson, 1987; Tijani, 2008). Note that in addition to the far field, low deviators are important in the long-term (salt cavern abandonment, nuclear waste disposal) and at shallow depths. Therefore, short and long temporal and spatial scales are concerned.
The main reason why low differential stresses have not been properly investigated at the laboratory is technical: at low differential stresses viscoplastic strains (and strain rates) are very small, and require very stable experimental conditions (applied stresses, temperature, relative humidity in case of unjacketed samples) to be accurately studied. As an example, the linear thermal expansion coefficient of natural salt, αth, is often comprised between 3 and 4 ∙ 10−5 K−1; a thermal fluctuation of 1 K induces a strain of 3–4 ∙ 10−5, or 30–40 μm/m, which is comparable to the viscoplastic strain cumulated for several weeks under a low deviatoric stress (see for instance Fig. 6 in Bérest et al., 2023). The same can be said of the applied stresses: small fluctuations may lead to unavoidable changes in the strain and strain rate, hindering a correct interpretation of the results. To overcome these experimental limitations, Hunsche (1988) performed uniaxial creep tests in a dedicated experimental device in which temperature was controlled to ±0.01 °C. More recently, Bérest et al. (2005; 2019; 2023) and Gharbi et al. (2020) performed uniaxial creep tests in remote drifts in underground salt mines (Varangéville in France and Altaussee in Austria), where temperature fluctuations are naturally very small: ±0.01–0.03 °C. The deviatoric stress range investigated lies between 0.1 and 4.5 MPa, and the axial loads were applied using dead weights, which are perfectly stable over long periods of time and require little maintenance. The main findings of these experiments can be summarized as follows. First, the creep rates at low-moderate differential stresses are considerably larger than those extrapolated from the high stress domain (i.e., deviatoric stresses larger than 5 MPa, investigated at the laboratory scale). Second, the deviatoric stress dependency of the creep rate is different under low and high levels: it is close to linear below 3 MPa, and highly non-linear beyond 5 MPa. Third, the transition between the two domains lies between 3–4.5 MPa (Bérest et al., 2023). Fourth, transient creep under low differential stresses is very long; after 8 months of constant loading at a temperature of 7.8 °C (Altaussee mine), the creep rates are not constant for most tests. Results from these experiments are very important because they suggest that in the current engineering practice, performing tests under high differential stresses and extrapolating the results towards low stress levels could lead to underestimation of the creep deformation, thereby affecting significantly the design, operation and long-term evolution of underground facilities. It should be noted however that these findings are based on experiments having noteworthy differences. Indeed, most tests at low deviatoric stresses have been performed at low temperature (mine temperature) and in uniaxial conditions, whereas tests at high differential stresses have been conducted in triaxial conditions and T ≥ 20 °C. Additionally, even if the same salt origin/facies was used for some of the tests in the two domains, the sample preparation method and the preconditioning procedure are rarely the same. Finally, the experimental data cannot be compared easily, as tests are often performed by different institutions, having different set-ups, measurement techniques, measurement scales, test durations and analysis methods. More recently, Blanco-Martín et al. (2023) conducted confined multi-stage creep tests at 50 °C covering the differential stress range 0.5–15 (or 20) MPa for each sample; however, investigating lower deviatoric levels in the laboratory is still challenging due to the technical reasons mentioned above.
In this paper, we present results of two ongoing multi-stage creep tests performed at the same temperature and having the same levels of deviatoric stress. One test is being performed in the Altaussee mine and the other test, the cross-check test, is being performed in the Centre for Geosciences and Geoengineering of Mines Paris in Fontainebleau. The goal of this test is to verify whether under similar conditions, the results in the laboratory and in the mine are comparable. The differential stress range chosen, 1.5–4.5 MPa, can be technically investigated in both facilities, although the low temperature imposed by the mine is difficult to maintain in the laboratory for long periods of time. The final target of this effort is to evaluate whether it is possible to combine results in the mine (where deviatoric levels as low as 0.1 MPa can be studied) with results in the laboratory at the same temperature (where higher deviatoric levels can be investigated), in order to characterize the behavior of rock salt under the range of deviatoric stresses that is relevant for underground operations.
2 Materials and methods
2.1 Preliminary considerations
Two samples are investigated in this study, prepared from Leine z3 rock salt extracted at the Bernburg mine (Germany) at a depth of 500 m. X-ray diffraction reveals a quite pure rock salt, having 96.4% halite, 3.2% dolomite and 0.4% anhydrite. The grain size is quite variable, spanning from μm to cm. The samples were prepared from 25 × 25 × 15 cm3 blocks using a vertical drilling machine. The rotation speed is 450 rpm and the vertical penetration speed is 1 cm/min. For the mine, sample diameter is 65 mm and for the laboratory, sample diameter is 50 mm; the slenderness ratio is 2 in both cases. The sample size is dictated by the experimental devices used in the two facilities. After coring, the upper and lower surfaces were polished to ensure parallelism and to reduce roughness. After preparation, the samples were subjected to a 21 day-long hydrostatic preconditioning phase under stress and temperature conditions close to those in situ: p = 12 MPa (mean pressure) and T = 30 °C. The main objective of this phase is to heal, at least partially, the perturbations induced during the coring, preparation, storage and handling phases. Prior to jacketing the samples, a thin layer of saturated brine (prepared using osmotic water and Leine rock salt) was applied to their lateral surface to correct any possible drying and to ease healing of any possible micro-fracture. A comparison of the surface state of the samples before and after the hydrostatic phase can be observed in Figure 1. The healing can be visually appreciated. X-ray micro-tomography (XRMCT) was performed at Laboratoire Navier (École des Ponts ParisTech) on the Altaussee sample before and after this phase, reflecting, at least qualitatively, that some healing occurred, see Figure 2. After the hydrostatic phase, the samples were kept vacuum-packaged at constant temperature until they were installed in the experimental frames.
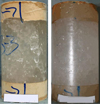 |
Fig. 1 Leine sample (65 mm diameter) before (left) and after (right) a 21 day-long hydrostatic phase under p = 12 MPa and T = 30 °C. The same view is shown in both pictures. Éprouvette de sel Leine (diamètre 65 mm) avant (gauche) et après (droite) une phase hydrostatique de 21 jours à p = 12 MPa et T = 30 °C. Les deux photos montrent la même vue de l’échantillon. |
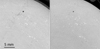 |
Fig. 2 Transverse cross-sections through XRMCT 3D image of the Leine salt sample tested in the Altaussee mine. Voxel size is 24 μm. Details around visible micro-fractures before (left) and after (right) the 21 day-long hydrostatic phase. During this phase, the visible pore (black zone in the upper central area) has been partially filled with brine. The white and dark gray phases within the salt matrix are impurities. Coupes transversales obtenues par microtomographie à rayons X 3D de l’éprouvette de sel Leine testée dans la mine de Altaussee. La taille du voxel est de 24 μm. Les images montrent des détails autour des microfissures avant (gauche) et après (droite) la phase hydrostatique de 21 jours. Pendant cette phase, le pore visible dans la partie centrale supérieure de l’image (en noir) a été partiellement rempli avec de la saumure. Dans la matrice de sel, les impuretés correspondent aux phases blanches et gris foncé. |
2.2 Experiment in the Altaussee mine
The creep test underway in the mine comprises three loading stages: 1.5, 3 and 4.5 MPa. The test is uniaxial (therefore, the axial stress is equal to the differential stress) and unjacketed, and it is conducted in a loading frame equipped with a force-multiplier system and dead weights (steel disks), see Figure 3. The sample is placed between two horizontal duralumin platens and the load is transmitted to the upper platen using a small steel ball (see enlarged view in Fig. 3). During quiescent periods, temperature fluctuations are about ±0.01–0.02 °C and relative humidity fluctuations are about ±0.02–0.03%. The evolution of the ambient conditions during the test is displayed in Figure 4. Temperature is measured with a Pt1000 sensor and relative humidity is measured with a HygroMer IN-1 probe. Sudden variations, such as those in days 0, 250 and 419, are due to the presence of staff working in the drift. Sample axial displacement is measured at four locations, diametrically opposed in two vertical planes at a 90 ° angle, using high resolution (1/80 μm) sensors (Solartron linear encoders, visible in Fig. 3). The acquisition (and recording) frequency is 1/60 Hz. Details about the measurement of axial displacements are provided in Bérest et al. (2023). The axial strain is computed from the average of the four displacement sensors. Note that sensor measurements comprise sample vertical displacement and crushing of the platen-sample interfaces; such crushing may be responsible for part of the initial instantaneous strain, as will be discussed in Section 3.
The test started in July 2022 and each loading stage lasts for at least 8 months. Two loading stages have been completed so far. As it will be shown in Section 3, after 8 months steady state has not been reached in any of the loading stages, confirming that the transient phase is very long when the temperature is low.
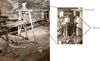 |
Fig. 3 View of the loading system in the Altaussee mine (for axial stresses greater than 1 MPa) and enlarged view around the sample (adapted from Bérest et al., 2023). Sample diameter is 65 mm, height is 130 mm. Vue du bâti de fluage dans la mine de Altaussee (système pour les contraintes axiales supérieures à 1 MPa) et vue agrandie autour de l’échantillon (image adaptée de Bérest et al., 2023). L’éprouvette a un diamètre de 65 mm et une hauteur de 130 mm. |
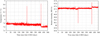 |
Fig. 4 Temperature (left) and relative humidity (right) during the Altaussee test. Raw data are smoothed using a Savitzky-Golay filter of order 5 and 12 h of filter window length. Température (gauche) et humidité relative (droite) pendant l’essai en cours dans la mine de Altaussee. Les données brutes sont lissées avec un filtre Savitzky-Golay d’ordre 5 et fenêtre 12 h. |
2.3 Experiment in the Centre for Geosciences and Geoengineering of Mines Paris
The creep test underway in the laboratory comprises three initial stages equal to those at Altaussee: 1.5, 3 and 4.5 MPa of differential stress. These steps at low-moderate levels will be followed by additional steps at higher deviatoric stress, with the objective of investigating a large relevant stress range for underground applications. The test is confined (the sample is jacketed), with a confining pressure of 0.2 MPa; this value is the minimum that can be controlled accurately with the current system and is not far from the uniaxial case (the test in Altaussee is uniaxial). The experiment is performed in a compact climatic chamber (Secasi SH 340) under a pre-set temperature of 8 °C. Figure 5 shows a picture of the climatic chamber and a cutaway of the triaxial cell. The relative humidity within the chamber is 50 ± 0.2%; note that the sample is not exposed to the air in the chamber, but humidity is monitored to verify that it stays within a range that does not affect sensors operation. The axial stress and the confining pressure are applied by means of in-house designed pressure injectors. To verify the convection in the chamber and to get some redundancy, temperature is measured using thermo-couples placed at the top and bottom of the chamber (measuring the temperature of the convection air) and inside the triaxial cell (measuring the temperature of the confining fluid). An extra logger was installed close to the bottom thermocouple for some time. The axial displacement of the sample is measured by means of a LVDT sensor placed on top of the upper piston of the triaxial cell; therefore, in addition to sample displacement, the LVDT measurements include the deformation of the pistons (assumed negligible compared to sample deformation) and the crushing of the piston-sample interfaces. The axial and lateral pressures are measured using pressure transmitters. The thermocouples, LVDT and pressure transducers have been calibrated to ±0.2 °C, ±5 μm and ±0.2 MPa, respectively; their true accuracy is higher. The acquisition frequency is high (1 Hz). Measurements of axial displacement, temperature (3 sensors), axial stress and confining pressure are compared against predefined thresholds and if any threshold is exceeded, the data is written to a file; otherwise, data are recorded every 5 min.
As Figure 5 shows, the pressure injectors are not placed inside the chamber due to lack of space. The temperature of the room is controlled to 22 ± 1 °C. Before starting the test, the system is left at 8 °C for 48 h to allow for thermal stabilization of all components. During the test, the displacement rate of hydraulic fluid is small (not higher than 0.06 mm/day for the confining line and much less for the axial line), and we assume that the fluid temperature within the chamber is equal to the chamber temperature.
Figure 6 shows the evolution of temperature, axial stress and confining pressure during the test. The test has been running since April 2023, and results are currently available only for the first differential stress stage at 1.5 MPa. As it can be seen, the temperature at the top of the chamber is slightly higher than that at the bottom due to the forced convection. Six technical incidents have occurred with an impact on the cell temperature (the closest to the sample temperature); however, apart from the 48 h power cut at day 24, the duration of the incidents was 8–12 h, and the impact on the axial displacement and derived strain is limited as it will be seen in the next section (in fact, the long-term fluctuations of temperature have a higher impact on the measured strain). Outside the technical incidents, maximum and minimum temperature are 8.1 and 7.5 °C, respectively. On day 7, the axial stress was increased to 1.7 MPa for consistency with the mine test (the differential stress should be equal in both tests, and here P = 0.2 MPa).
Overall, even if the thermal and mechanical loads reflect less stability in the laboratory test as compared to the mine test—due to the technical limitations of the equipment— this test is deemed satisfactory considering its long duration and the experimental challenges associated to it. The stress range chosen, 1.5–4.5 MPa, allows for a comparison with the mine test as it will be shown in the next section.
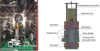 |
Fig. 5 View of the experimental device in the Centre for Geosciences and Geoengineering to conduct a multi-stage creep test at T = 8 °C (left) and cutaway of the creep cell (right). Sample diameter is 50 mm, height is 100 mm. Vue du dispositif expérimental au Centre de Géosciences pour effectuer des essais de fluage multi-palier à faible température (ici T = 8 °C [gauche]) et coupe de la cellule de fluage (droite). L’éprouvette a un diamètre de 50 mm et une hauteur de 100 mm. |
3 Results
Figures 7 and 8 show the strain data corresponding to the mine test and to the laboratory test, respectively. A direct comparison is delicate because the experimental conditions have some differences. Indeed, in the mine the displacement sensors measure axial compression of the sample and crushing of the sample-piston interfaces, whereas in the laboratory the axial compression of the pistons is measured as well, although it is negligible compared to the other two. Even if higher in the mine, displacement sensor resolution in the laboratory is enough for the testing conditions. The main difference is the stability of the applied thermo-mechanical load, in particular the thermal stability as shown in Figure 6. Incessant thermal fluctuations induce changes in thermoelastic strains. Heat propagation in the sample through conduction is a relatively slow process, and separation of thermoelastic strains from viscoplastic strains is difficult (Bérest et al., 2023). Thermal fluctuations happen in the two tests, but they are larger in the laboratory test, affecting the strains to a larger extent than in the mine.
The initial offset that can be observed in the two curves is likely due to the crushing of residual asperities in the sample-piston interfaces (both samples were polished in the same way). At Altaussee, from the initial instantaneous strain increase a Young’s modulus of E ≈ 5.8 GPa is inferred, but from the first to the second loading stage (when the axial load is increased from 1.5 to 3 MPa), E ≈ 22.5 GPa — a more realistic value for Leine rock salt (from laboratory strain-controlled tests instrumented with strain gauges, an average value of E = 27 GPa is obtained). Initially, crushing of asperities in the upper and lower interfaces can potentially affect the displacement measurements. In the laboratory test, the instantaneous initial strain increase is about 500 μm/m higher than in the mine, which corresponds to a displacement of only 50 μm —a figure in the same order of magnitude than measured asperity height, see Bérest et al. (2019). Overall, despite the lower smoothness of the laboratory strain data, and apart from the initial offset, the trends of the two curves are similar and consistent (two natural salt samples are being used, and there is inherently some sample-to-sample variability as well). Note that for the laboratory test, the sudden increase in the strain at day 7 is due to the increase in axial stress from 1.5 to 1.7 MPa for consistency with the mine data (see axial stress increase in Fig. 6 right).
The strain rates are compared in Figure 9. For the mine test, the erratic variations due to incessant, but small changes in the ambient conditions are smoothed within each loading stage using a moving average with a sample window of 4 days. In turn, as explained above, for the laboratory test the axial strain fluctuations are inevitably more important due to the poorer temperature stability. Three steps are taken to smooth the strain data. First, a moving average with a small sample window is applied to reduce the noise. Second, the resulting strain is interpolated on non-evenly spaced points to describe more finely the initial strain increase. Finally, a moving average with a large sample window is applied to the interpolated strain data. As the figure shows, the mine and the laboratory strain rates are consistent despite the important fluctuations in the laboratory test. For a differential stress of 1.5 MPa at 8 °C, after 8 months the rate is about 3.4 10−12 s−1 (non-constant).
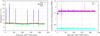 |
Fig. 6 Temperature inside the climatic chamber (left) and mechanical loading (right) during the laboratory test. The raw temperature data is smoothed using a median filter with a window size of 3.5 h. Température à l’intérieur de l’enceinte climatique (gauche) et chargement mécanique (droite) pendant l’essai de fluage en cours au Centre de Géosciences. Les données brutes de température sont lissées avec un filtre médian de fenêtre 3,5 h. |
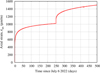 |
Fig. 7 Axial strain during the mine test. Loading stages are 1.5 and 3 MPa. Déformation axiale pendant l’essai de fluage en cours dans la mine de Altaussee. Les paliers de charge sont 1,5 et 3 MPa. |
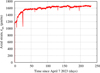 |
Fig. 8 Axial strain during the laboratory test, ongoing loading stage at 1.5 MPa of differential stress. Déformation axiale pendant l’essai de fluage au Centre de Géosciences (palier en cours sous déviateur de 1,5 MPa). |
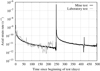 |
Fig. 9 Comparison of the axial strain rates during the two tests. Comparaison des vitesses de déformation axiale pendant les deux essais. |
4 Discussion and conclusions
The preliminary results suggest that under similar conditions, the results obtained in the mine and in the laboratory are consistent with each other. A particular challenge of the laboratory test is the control of a low temperature (8 °C) over long time periods. The mine offers very small fluctuations of the ambient conditions, combined with very stable applied loads and high-resolution sensors, all of which are necessary to investigate time-dependent deformation under low differential stresses. In turn, the laboratory offers the possibility to conduct confined tests —which are more representative of underground situations— and to investigate a large range of differential stresses (starting at 0.5–1 MPa if the experimental conditions are addressed carefully) and different temperatures (in particular, it is easier to control temperatures higher than the ambient). The combination of the two experimental facilities is beneficial to extend the studied range of deviatoric stresses relevant for underground applications, thereby reducing stress extrapolation. As we obtain more results at additional differential stresses and temperatures, constitutive laws will be confronted to the data and the necessary modifications will be undertaken. Additional tests at higher temperature (30 and 60 °C) are underway in the laboratory on Leine salt samples in the deviatoric range 0.5–20 MPa to include the effect of temperature in the analysis. The final target is to develop constitutive laws that, at least phenomenologically, account for any possible different creep behavior under high and low deviatoric stresses, at different temperatures.
In parallel, a uniaxial creep test is underway at the Varangéville salt mine, comprising three stages at 0.2, 0.4 and 0.6 MPa. The temperature in the drift is 14 ± 0.03 °C, which is about double of that in the Altaussee mine, but much smaller than typical temperatures tested in the laboratory. A Leine salt sample, prepared and preconditioned following the same protocol as in the two tests shown, is being tested. Our goal is to combine the two mine tests with the laboratory test to investigate a large stress range (0.2 to 15 MPa) at similar temperatures (8–14 °C). Indeed, the laboratory test will be pursued with higher differential stresses. A difference exists however between the mine and the laboratory tests: the former use unjacketed samples, whereas the latter uses a jacketed sample. Drainage of intergranular brine could play a major role at low differential stresses, as previous studies suggest that dynamic recrystallization and diffusion-driven creep mechanisms at the interfaces (such as pressure solution) could be dominant at low stress deviators, and they require the presence of thin brine layers around crystals (Spiers et al., 1990, Urai and Spiers, 2007). Such drainage is likely enhanced by the small confining pressures being used: dilatancy is mean pressure dependent, and dilatancy has been observed to facilitate drainage around crystals and inhibit dynamic recrystallization and pressure solution (Urai et al., 1986). In future mine tests, the samples will be jacketed, and more attention will be paid to the intergranular fluids. Another perspective is to conduct confined creep tests in the mines.
Acknowledgements
Pr. Pierre Bérest (École Polytechnique, France) was an international expert on rock salt and salt caverns and studied creep of rock salt under low deviatoric stresses, highlighting its importance for underground structures. His efforts have been acknowledged by the international salt mechanics community. He put a lot of effort in the design and operation of the mine tests and was actively involved in the definition of the cross-check test between the mine and the laboratory. He was a key member of the ANR RockStorHy project. We are indebted for all his support and sharing of ideas.
Funding
Funding for this study has been provided by the ANR under contract number ANR-21-CE05-0027-05 (RockStorHy project). We would like to thank IfG (Institute für Gebirgsmechanik GmbH, Leipzig) for kindly providing the rock salt blocks that served to prepare the samples. We also thank Compagnie des Salins du Midi et des Salines de l’Est (CSME) and Salinen Austria AG for accepting to run the mine tests.
References
- Bérest P, Blum P, Charpentier JP, et al. 2005. Very slow creep tests on rock samples. Int J Rock Mech Min Sci 42 (4): 569–576. [CrossRef] [Google Scholar]
- Bérest P, Brouard B, Brückner D, et al. 2019. Very slow creep tests on salt samples. Rock Mech Rock Eng 52: 2917–2934. https://doi.org/10.1007/s00603-019- 01778-9 [Google Scholar]
- Bérest P, Gharbi H, Blanco-Martín L, et al. 2023. Salt creep: transition between the low and high stress domains. Rock Mech Rock Eng 56: 8305–8316. https://doi.org/10.1007/s00603-023-03485-y [Google Scholar]
- Blanco-Martín L, Rouabhi A, Hadj-Hassen F, et al. 2023. Creep of rock salt under a large range of deviatoric stresses. Accepted for publication in Rock Mech Rock Eng. [Google Scholar]
- DeVries KL. 1988. Viscoplastic laws for Avery Island salt. RE/SPEC Inc., Rapid City, SD, RSI-0333, Prepared for Stone & Webster Engineering Corporation, Boston [Google Scholar]
- Gharbi H, Bérest P, Blanco-Martín L, Brouard B. 2020. Determining upper and lower bounds for steady state strain rate during a creep test on a salt sample. Int J Rock Mech Min Sci 134: 104452. https://doi.org/10.1016/j.ijrmms.2020.104452 [CrossRef] [Google Scholar]
- Herchen K, Popp T, Düsterloh U, et al. 2018. WEIMOS: Laboratory investigations of damage reduction and creep at small deviatoric stresses in rock salt. In Fahland, Hammer, Hansen, et al. eds. 9th Conference Mechanical Behavior of Salt (Saltmech IX), Hanover, Germany pp. 175–192. [Google Scholar]
- Hunsche U. 1988. Measurement of creep in rock salt at small strain rates. In Reginald Hardy Jr., Langer eds. 2nd Conference Mechanical Behavior of Salt (Saltmech II), Hanover, Germany, pp. 187–196. [Google Scholar]
- Lüdeling C, Günther RM, Hampel A, et al. 2022. WEIMOS: Creep of rock salt at low deviatoric stresses. In de Bresser, Drury, Fokker, et al. eds. 10th Conference Mechanical Behavior of Salt (Saltmech X), Utrecht, The Netherlands, pp. 130–140. [Google Scholar]
- Paterson MS. 1987. Problems in the extrapolation of laboratory rheological data. Tectonophysics 133 (1-2): 33–43. https://doi.org/10.1016/0040-1951(87)90278-2 [CrossRef] [Google Scholar]
- Spiers CJ, Schutjens PMTM, Brzesowsky RH, et al. 1990. Experimental determination of constitutive parameters governing creep of rocksalt by pressure solution. Geol Soc London, Spec Publ 54 (1): 215–227. https://doi.org/10.1144/GSL.SP.1990.054.01.21 [CrossRef] [Google Scholar]
- Tijani M. 2008. Contribution à l’étude thermomécanique des cavités réalisées par lessivage dans des formations géologiques salines. Habilitation à diriger des recherches, Université Pierre et Marie Curie − Paris VI. [Google Scholar]
- Urai JL, Spiers CJ, Zwart H, et al. 1986. Weakening of rock salt by water during long-term creep. Nature 324: 554–557. https://doi.org/10.1038/324554a0 [CrossRef] [Google Scholar]
- Urai JL, Spiers CJ. 2007. The effect of grain boundary water on deformation mechanisms and rheology of rocksalt during long-term deformation. In Wallner M, Lux KH, Minkley W, et al. eds. 6th Conference Mechanical Behavior of Salt (Saltmech VI), Hanover, Germany, pp. 149–158. [Google Scholar]
Cite this article as: Laura Blanco-Martín, Jubier A. Jiménez-Camargo, Jerzy Jaworowicz, Hakim Gharbi, Alexandre Dimanov, Michel Bornert, Benoît Brouard. Rock salt creep: a cross-check test to cover the full relevant range of deviatoric stresses Rev. Fr. Geotech. 2023, 177, 1.
All Figures
|
Fig. 1 Leine sample (65 mm diameter) before (left) and after (right) a 21 day-long hydrostatic phase under p = 12 MPa and T = 30 °C. The same view is shown in both pictures. Éprouvette de sel Leine (diamètre 65 mm) avant (gauche) et après (droite) une phase hydrostatique de 21 jours à p = 12 MPa et T = 30 °C. Les deux photos montrent la même vue de l’échantillon. |
| In the text | |
|
Fig. 2 Transverse cross-sections through XRMCT 3D image of the Leine salt sample tested in the Altaussee mine. Voxel size is 24 μm. Details around visible micro-fractures before (left) and after (right) the 21 day-long hydrostatic phase. During this phase, the visible pore (black zone in the upper central area) has been partially filled with brine. The white and dark gray phases within the salt matrix are impurities. Coupes transversales obtenues par microtomographie à rayons X 3D de l’éprouvette de sel Leine testée dans la mine de Altaussee. La taille du voxel est de 24 μm. Les images montrent des détails autour des microfissures avant (gauche) et après (droite) la phase hydrostatique de 21 jours. Pendant cette phase, le pore visible dans la partie centrale supérieure de l’image (en noir) a été partiellement rempli avec de la saumure. Dans la matrice de sel, les impuretés correspondent aux phases blanches et gris foncé. |
| In the text | |
|
Fig. 3 View of the loading system in the Altaussee mine (for axial stresses greater than 1 MPa) and enlarged view around the sample (adapted from Bérest et al., 2023). Sample diameter is 65 mm, height is 130 mm. Vue du bâti de fluage dans la mine de Altaussee (système pour les contraintes axiales supérieures à 1 MPa) et vue agrandie autour de l’échantillon (image adaptée de Bérest et al., 2023). L’éprouvette a un diamètre de 65 mm et une hauteur de 130 mm. |
| In the text | |
|
Fig. 4 Temperature (left) and relative humidity (right) during the Altaussee test. Raw data are smoothed using a Savitzky-Golay filter of order 5 and 12 h of filter window length. Température (gauche) et humidité relative (droite) pendant l’essai en cours dans la mine de Altaussee. Les données brutes sont lissées avec un filtre Savitzky-Golay d’ordre 5 et fenêtre 12 h. |
| In the text | |
|
Fig. 5 View of the experimental device in the Centre for Geosciences and Geoengineering to conduct a multi-stage creep test at T = 8 °C (left) and cutaway of the creep cell (right). Sample diameter is 50 mm, height is 100 mm. Vue du dispositif expérimental au Centre de Géosciences pour effectuer des essais de fluage multi-palier à faible température (ici T = 8 °C [gauche]) et coupe de la cellule de fluage (droite). L’éprouvette a un diamètre de 50 mm et une hauteur de 100 mm. |
| In the text | |
|
Fig. 6 Temperature inside the climatic chamber (left) and mechanical loading (right) during the laboratory test. The raw temperature data is smoothed using a median filter with a window size of 3.5 h. Température à l’intérieur de l’enceinte climatique (gauche) et chargement mécanique (droite) pendant l’essai de fluage en cours au Centre de Géosciences. Les données brutes de température sont lissées avec un filtre médian de fenêtre 3,5 h. |
| In the text | |
|
Fig. 7 Axial strain during the mine test. Loading stages are 1.5 and 3 MPa. Déformation axiale pendant l’essai de fluage en cours dans la mine de Altaussee. Les paliers de charge sont 1,5 et 3 MPa. |
| In the text | |
|
Fig. 8 Axial strain during the laboratory test, ongoing loading stage at 1.5 MPa of differential stress. Déformation axiale pendant l’essai de fluage au Centre de Géosciences (palier en cours sous déviateur de 1,5 MPa). |
| In the text | |
|
Fig. 9 Comparison of the axial strain rates during the two tests. Comparaison des vitesses de déformation axiale pendant les deux essais. |
| In the text | |
Current usage metrics show cumulative count of Article Views (full-text article views including HTML views, PDF and ePub downloads, according to the available data) and Abstracts Views on Vision4Press platform.
Data correspond to usage on the plateform after 2015. The current usage metrics is available 48-96 hours after online publication and is updated daily on week days.
Initial download of the metrics may take a while.