")
")
| Issue |
Rev. Fr. Geotech.
Number 177, 2023
Hommage à Pierre Bérest
|
|
|---|---|---|
| Article Number | 5 | |
| Number of page(s) | 12 | |
| DOI | https://doi.org/10.1051/geotech/2024020 | |
| Published online | 11 avril 2024 | |
Research Article
A versatile device for measuring the mode I fracture toughness with application to estimate the impact of water weakening in chalks
1
CY Cergy Paris Université, GEC, 95000 Cergy, France
2
Now at Stratum Reservoir, Aktau, Kazakhstan
3
GFZ German Research Centre for Geosciences, Potsdam, Germany
* Corresponding author: Cette adresse e-mail est protégée contre les robots spammeurs. Vous devez activer le JavaScript pour la visualiser.
Abstract
A newly built versatile device for mode I fracture toughness measurement is presented. To test this apparatus, measurements have been conducted on two crystalline rocks, the Aue Granite and the Äspö Diorite, and two chalks from the Paris basin, Obourg and Ciply chalks. The fracture toughness KIC can be measured with two different testing procedures, the Semi-Circular Bend (SCB) and the Straight Edge Cracked Round Bar Bend (SECRBB) methods, both known for the easiness of the notched sample preparation. For the SCB tests, ultrasonic sensors were mounted at the sample surface to monitor changes in P-wave velocity and record acoustic emission activity. Our results are in reasonably good agreement with published data on the same rocks. The SECRBB test provides values of the fracture toughness 37% higher compared to the SCB test for the Obourg chalk. This discrepancy may be explained by a sample size effect. The fracture toughness of water saturated chalks is strongly reduced compared to that of the dry chalks by almost 50%. This shows that fracture toughness is a valuable parameter to assess the importance of water weakening in porous rocks.
Résumé
Un nouveau dispositif expérimental versatile pour la mesure de la ténacité en mode I est présenté. Pour tester cet appareil, des mesures ont été réalisées sur deux roches cristallines, le granite d’Aue et la diorite d’Äspö, et sur deux craies du Bassin de Paris, les craies d’Obourg et de Ciply. La ténacité KIC peut être mesurée de deux manières différentes, avec la méthode SCB (Semi-Circular Bending) ou la méthode SECRBB (Straight Edge Cracked Round Bar Bend), connues toutes deux pour la facilité de préparation des échantillons rainurés. Pour les tests avec la méthode SCB, des capteurs ultrasoniques ont été installés à la surface des échantillons pour étudier la variation de la vitesse des ondes P et pour enregistrer l’activité en émissions acoustiques. Nos résultats sont en assez bon accord avec des données publiées pour ces mêmes roches. La méthode SECRBB donne une valeur de ténacité 37% plus grande que la méthode SCB pour la craie d’Obourg. Cet écart peut être expliqué par un effet de taille d’échantillon. La ténacité des craies saturées en eau est fortement réduite par rapport aux craies sèches de près de 50%. Ceci montre que la ténacité est un bon paramètre pour mettre en évidence l’importance des effets d’affaiblissement en présence d’eau dans les roches poreuses.
Key words: Fracture toughness / ultrasonic monitoring / water weakening / granite / chalk
Mots clés : Ténacité / monitoring ultrasonique / affaiblissement mécanique par l’eau / granite / craie
© CFMS-CFGI-CFMR-CFG, 2023
1 Introduction
The fracture toughness is an important parameter in fracture mechanics related to the critical stress needed to propagate a pre-existing crack in a solid material. The far and remote stress field acting on a rock body is amplified at the tip of flaws or microcracks; this amplified stress, allows a crack to propagate when the so-called stress intensity factor (K) reaches a critical value, the fracture toughness. In fracture mechanics, the displacement field of a crack is classified in three types, with mode I corresponding to opening crack, mode II to shearing crack and mode III to tearing crack. In the first case on which we will focus hereafter, the mode I fracture toughness is called KIC: it corresponds to the threshold value of the stress intensity factor KI in opening or extensional mode at the onset of crack propagation and depends on the applied load and crack geometry.
Several methodologies to derive the mode I fracture toughness can be found in the literature, which differ on the sample shape and/or testing configuration. Among them, four methods have been suggested by the International Society for Rock Mechanics (ISRM): the Cracked Chevron Notched Brazilian Disk (CCNBD) test which is widely adopted in laboratory tests (Fowell et00A0;al., 1995; Nasseri et00A0;al., 2006; Xu et00A0;al., 2016), the Chevron Bend (CB) test, the short rod (SR) test (Ouchterlony, 1989) and the Semi-Circular Bend (SCB) test (Kuruppu et00A0;al., 2014). Furthermore, the Straight Edge Cracked Round Bar Bend (SECRBB) test has been also adopted by Sun and Ouchterlony (1986) and Haberfield and Johnston (1990). A common feature of these tests is the stress concentration near the tip of an artificial notch so that, reaching a critical value, the applied stress induces crack propagation from the notch tip, leading to the sample failure.
Both the SCB and SECRBB tests are characterized by their easiness of sample preparation and testing procedure; moreover, they can be performed on a single testing machine, a triple-point loading device which in turn provides a good versatility in the sample specification. A single device has been developed at CY Cergy Paris University (CYU) which allows one to perform either SCB or SECRBB tests on rock samples to estimate the mode I fracture toughness KIC. The aim of this work is to present the newly built device as well as the validation tests that were conducted on crystalline rocks with known properties. As an application, series of measurements on dry and water-saturated chalks from the Paris Basin are presented, to show the relevance of fracture toughness studies in order to assess water weakening effects. Indeed, the strength reduction in presence of water, generally defined as water weakening, has been studied and characterized for several years at CYU within the framework of an international collaboration with CSIRO Energy in Perth, Australia and the University of Mons, Belgium (Geremia et00A0;al., 2021a). In that project, the context of application is on one hand the risk related to underground flooded quarries where a water table fluctuation makes the pillars to degrade steadily, and on the other hand the secondary recovery of oil where fluids like seawater are injected into hydrocarbon reservoirs to both build-up the fluid pressure and to enhance the production. Any other kind of processes involving water injection may also be impacted by water weakening effects. Our work shows that fracture toughness studies provide insightful information to characterize the weakening induced by water in porous rocks.
2 Methodology
2.1 Description and principle of the methods
In the following, only two KIC measurement techniques will be considered, the SCB and the SECRBB tests. In Figure 1 both testing configurations are displayed. The load is applied through three rollers, one of which is fixed to the top piston of the loading frame, centred with the notch, whereas the two other ones at the bottom are located at equal distance from the notch with a span length or spacing s. Note that the bottom rollers are free to roll in order to minimize friction effects during loading. For the SCB test, the sample geometry is characterized by the radius R (or diameter D = 2R), the thickness B (not shown in Fig. 1) and the notch length a. For the SECRBB test, the sample is a long cylinder with length L, radius R (or diameter D = 2R) and notch length a. In both tests the thickness of the notch should not be larger than 1 mm. The load F is applied in the direction of the notch as shown in Figure 1. According to Kuruppu et00A0;al. (2014), care needs to be taken to correct for the thickness of the sawcut when estimating the sample radius and notch length.
For the SCB test, the mode I fracture toughness is given by:
 (1)
(1)
where Fmax is the peak load at failure. The dimensionless stress intensity factor Y is given by:
 (2)
(2)
where β = a/R (Kuruppu et00A0;al., 2014).
For the SECRBB test, the mode I fracture toughness is computed from the peak load at failure Fmax as follows (Sun and Ouchterlony, 1986):
 (3)
(3)
where the dimensionless stress intensity factor Y’ is defined by:
 (4)
(4)
with α = a/D. Note that equation (4) is only valid for α lower than 0.6. Note that the numerical constants in equations (2) and (4) were obtained by a least-squares fitting scheme on the parametric analysis results obtained by finite element computing, exploring different sample/notch/spacers configurations (Kuruppu et00A0;al., 2014). To our knowledge, these constants can be used for any type of material.
Table 1 provides the range of sample and notch dimensions which are allowed for the previous equations to be valid and accurate. In the experiments presented here, these conditions were systematically fulfilled.
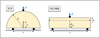 |
Fig. 1 Sample geometry for the SCB and SECRBB tests using both a three-point loading configuration. Géométrie des échantillons pour les essais SCB et SECRBB utilisant tous les deux un chargement en trois points. |
Recommended geometrical dimensions of SCB and SECRBB tests (after (Kuruppu et00A0;al., 2014).
Valeurs recommandées pour les dimensions des échantillons pour les tests SCB et SECRBB (d’après (Kuruppu et00A0;al., 2014).
2.2 New testing device and experimental procedure
The versatile device built for the Geomechanics lab at CYU, allowing to conduct mechanical tests either in SCB or in SECRBB configuration, is shown in Figure 2. The sketch in Figure 2a was done during the designing stage and shows the SECRBB configuration. The actual device in SCB configuration is shown on the photograph in Figure 2b. The system consists of a three-point loading apparatus designed to be installed on a GDS VIS uniaxial loading frame from GDS Instruments Ltd™ with maximum load capability of 100 kN. Note that the same loading frame is also used for other mechanical tests, like uniaxial compression tests, or Brazilian tests. During loading, the axial force is measured by a load cell located in the upper plate with an accuracy of 0.01 kN, and the axial displacement is derived from the rotation of the stepping motor controlling the axial motion (accuracy 1 μm).
As mentioned before, the load is applied to the sample through three cylindrical rollers. These are made of stainless steel and have a diameter of 10 mm and a length of 60 mm. The upper roller is fixed on a piston-like holder fixed to the GDS loading frame through 12 magnets (Fig. 2b). The two bottom rollers are identical to the upper one, but are free to move on U-shaped stainless steel holders during loading. The spacing between the bottom rollers can be adjusted between 20 mm up to 200 mm: this means for example that the largest samples that can be tested in the SECRBB configuration are cylinders with diameter 60 mm and length 240 mm. Note on Figure 2b that marks with spacing 5 mm were carved in the aluminium holder guide to be able to locate the mobile holders symmetrically with respect to the centre of the device: however the actual spacing between the rollers in each experiments needs to be measured with a better accuracy.
The procedure for both test types have some specifications regarding the position of the loading points, which are dictated by the sample size and the notch length (Tab. 1). In this work, semi-circular samples of 50 and 100 mm in diameter have been tested in the SCB configuration, whereas cylinders of 40 and 25 mm in diameter have been used with the SECRBB test. As the results may be influenced by the loading rate (Backers et00A0;al., 2003), all the tests have been conducted with a constant displacement rate of 0.025 mm/min which is well below the upper limit of 0.2 mm/min suggested by Kuruppu et00A0;al. (2014) to avoid dynamic effects. Note that the strain rate in our experiments is not always the same, as the sample and notch sizes are different. Nevertheless, the variability in strain rate is mild (within a factor 2 for each material) ranging from 1.5 × 10⁻⁶ s−1 to 4.5 × 10⁻⁶ s−1 over the whole data set, so that we don’t expect any significant strain rate effect in our results.
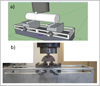 |
Fig. 2 (a) sketch of the newly developed device at CYU in the SECRBB test configuration. (b) photograph of the experimental setup in the SCB configuration with an Aue granite sample. (a) schéma du nouveau dispositif développé à CYU dans la configuration SECRBB. (b) photo du dispositif expérimental en configuration SCB avec un échantillon de granite d’Aue. |
3 Validation on rocks with known properties
In order to validate our new device, two rocks were selected, the Aue granite (AGR) and the Aspö diorite (ADR), for which the fracture toughness were measured previously and published in the literature. Aue granite is a red syeno-monzo-granite from the Erzgebirge, Germany, with composition 30% quartz, 60% felspar and 10% mica in volume; its grain size and porosity are about 1.3 mm and 1.3% respectively (Zang et00A0;al., 2000). The material from which our samples were produced was delivered by the Blauenthal quarry located near the city of Aue, Erzgebirge; this variety of granite is also named Eibenstock or Blauenthal. The Äspö diorite, Sweden, is a medium-grained, grey to reddish grey intrusive igneous rock (Staub et00A0;al., 2004) with plagioclase (41%), quartz (21%), chlorite (14%) and K-felspar (11%) as major minerals (Chung et00A0;al., 2019); its porosity is about 1.1% (Backers, 2004). The core from which our samples were produced come from the Äspö Hard Rock Laboratory in Sweden. The Aue Granite and Äspö Diorite cores were provided to CYU by GFZ Potsdam (Germany).
3.1 Sample preparation
Due to the geometry of the provided cores, the AGR samples were cut with a diamond saw lubricated with water and machined in order to obtain 13 half disks of 50 mm in diameter and about 25 mm in thickness. The ADR core allowed us to obtain 5 half disks with diameter 100 mm and thickness 50 mm. Unfortunately, there was not enough core material to produce long cylinders for the SECRBB tests, so that only SCB test were done. For both rocks the load has been applied perpendicular to the core axis as provided by GFZ. The notch has been produced with different methods depending on the rock type and sample geometry. For AGR, a low velocity band saw with a thickness of 0.25 mm has been used to produce a notch with length 12 mm (except one of 14.5 mm). For ADR, a 2 mm band saw has been used for a total notch length of 22 mm (except one of 28 mm). Note that the notch length given here have been corrected from the sawcut thickness as recommended by Kuruppu et00A0;al. (2014). The spacing s between the supporting rollers was such as s/D was close to 0.5 except two experiments where it was close to 0.8. The cutting of the samples and notches was systematically done with great care in order to minimize possible damage in the preparation stage.
After preparing the samples, the connected porosity has been measured for each AGR and ADR sample using the triple weight method, by measuring the mass of the dry sample (md), of the water-saturated sample (mw) and of the saturated sample immersed in a water tank (mimm). Prior to the water saturation, the samples were firstly vacuumed for at least 9 hours inside a bell jar, and left immersed in deaired water for at least one day. The connected porosity is given by ϕc = (mw − md)/(mw − mimm). Table 2 compiles the geometrical characteristics of all tested samples as well as the experimental results leading to an estimation of the mode I fracture toughness.
Sample properties, SCB testing parameters and experimental results for the estimation of the mode I fracture toughness in Aue granite and Äspö diorite.
Propriétés des échantillons, paramètres des essais SCB et résultats expérimentaux pour l’estimation de la ténacité en mode I dans le granite d’Aue et la diorite d’Äspö.
3.2 Fracture toughness results
Despite the relatively small number of samples, especially for the Äspö diorite, a statistical analysis was done which results are shown in Figure 3a.
For the Aue granite, 13 samples were tested in the SCB configuration and the average value for KIC is 0.99 MPa m1/2 with standard deviation 0.10 MPa m1/2. The range of values goes from 0.82 to 1.13 MPa m1/2 and the relative dispersion given by the coefficient of variation is about 10%. This range of mode I fracture toughness is close to that found by Guo et00A0;al. (2021) on a set of thermally heated Hong-Kong granite samples. Fig. 3b shows one of the AGR samples after testing. Usually, the crack propagates roughly in the direction of the notch plane; however, if we look at a close-up of the fracture (Fig. 3c) the crack looks very tortuous as it mainly follows the grain boundaries. The intergranular nature of the propagated crack suggests that the critical stress attained to propagate a mode I crack in Aue granite is linked more to the strength of the bonds between minerals rather than to the strength of the constitutive minerals.
For the Äspö diorite, only 5 samples were available, and an average value of KIC = 1.84 MPa m1/2 with standard deviation 0.08 MPa m1/2 was found (Fig. 3a). The range of values goes from 1.74 to 1.96 MPa m1/2 and the relative dispersion given by the coefficient of variation is about 4.4%. Compared to the Aue granite tests, the data for the Äspö diorite are relatively less scattered, which might be explained by the smaller number of tested samples, but also by the larger size of the tested samples.
For both Aue granite and Äspö diorite, our measurements are lower but still in the same range as the published values obtained with the Chevron Bend method: for Aue granite, Backers (2004) reported a value of 1.60 ± 0.13 MPa m1/2 and for Äspö diorite, values of 3.8 ± 0.1 MPa m1/2 were reported in Staub et00A0;al. (2004) and 3.21 MPa m1/2 in Backers (2004). Such discrepancies might be explained by differences in the composition of the rocks tested in each study, or in the methods to measure the fracture toughness. Although not fully conclusive, our tests on Aue granite and Äspö diorite give us some confidence on the relevance and accuracy of our newly built apparatus.
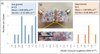 |
Fig. 3 (a) Histogram of mode I fracture toughness values for the Aue granite and the Aspö diorite. (b) Photograph showing a tested Aue granite sample with two P-wave ultrasonic sensors for active and passive acoustic monitoring. c) Closer view of the fracture ahead of the notch. (a) Histogramme des valeurs de ténacité en mode I pour le granite d’Aue et la diorite d’Aspö. (b) Photographie montrant un échantillon de granite d’Aue avec deux capteurs ultrasoniques d’onde P pour le monitoring actif et passif. c) Vue détaillée de la fracture partant de l’extrémité de l’entaille. |
3.3 Ultrasonic monitoring and AE recording during loading
During the tests, the AGR and ADR rock samples were instrumented with two ultrasonic sensors (PZTs) with central frequency 0.5 MHz located on the rounded external surface just above the notch tip, as shown in Figure 3b. These sensors were used both (i) in active mode, with pulses sent to the emitter PZT every 35 seconds for P-wave travel time measurements and (ii) in passive mode for acoustic emissions (AEs) detection. For the latter, the small number of sensors does not allow for AE localization, but permits only to analyse the AE activity during loading. The AE acquisition system is a Vallen AMSY-5. Typical results for each rock type are shown in Figure 4: the applied load, cumulative number of AEs recorded and normalized P-wave velocity VP/VPo (with VPo the velocity prior testing) for Aue granite sample AGR2 and Äspö diorite sample ADR1 are plotted as a function of time during an SCB test. The maximum load sustained by AGR2 is much lower than for ADR1, resulting in a smaller fracture toughness. The acoustic emission activity starts to increase slowly in a first stage, but when the applied load approaches the peak load, a sharp increase (also called surge) in acoustic emission activity for both sensors occurs near failure. At this point hundreds of AEs have been recorded. Note that for AGR2 another sharp increase is observed at mid-load, not correlated with macroscopic fracturing but possibly linked to internal cracking. The grey vertical bar in Fig. 4 marks the onset of the surge in AE activity, and the corresponding load was systematically measured. The P-wave velocity normalized to the initial one does not exhibit any significant change close to failure, which was surprising for us. For sample AGR2, a slight decrease (–2.4%) is observed which might not be significant. Only in one sample (AGR3), a sharp drop by about 30% in velocity was observed near failure.
Table 3 presents for all the samples the P- and S-wave velocities measured on the samples prior testing, the maximum number of AEs recorded, the load at the surge of AE activity expressed as a fraction of the peak load and comments on the change in P-wave velocity during loading. For Aue granite, the average P- and S-wave velocity are 4819 m/s (± 80 m/s) and 2504 m/s (± 125 m/s) respectively. For Äspö diorite, the average P- and S-wave velocity are 5684 m/s (± 197 m/s) and 3245 m/s (± 42 m/s) respectively, much higher than for the granite. When possible, the load at the surge of acoustic emission activity was measured and normalized to the maximum load. For the Aue granite this occurs very close to failure (average load ratio 93.1%) with no visible change in the slope of the loading curve (Fig. 4a), whereas for the Äspö diorite the AE surge takes place earlier (average load ratio 86.1%) while a change in slope is observed on the loading curve (Fig. 4b). In the diorite, the crack initiation seems to occur more progressively so that the surge in AE activity allows one to detect earlier the closeness of fracture propagation.
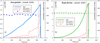 |
Fig. 4 Example of loading curve, recording of acoustic emission activity and evolution of normalized P-wave velocity VP/VPo for selected samples (a) Aue granite sample AGR2 and (b) Äspö diorite sample ADR1. The horizontal dashed lines correspond to VP/VPo =1. Exemple de courbe de chargement, d’enregistrement d’émissions acoustiques et d’évolution de la vitesse d’onde P normalisée VP/VPo pour des échantillons choisis (a) pour le granite d’Aue AGR2 et (b) pour la diorite d’Äspö ADR1. Les lignes horizontales en pointillés correspondent à VP/VPo =1. |
 |
Fig. 5 Some of the Obourg chalk samples used for SCB and SECRBB tests. Quelques échantillons de craie d’Obourg qui ont été testés dans les essais SCB et SECRBB. |
Results from measurements of P and S-waves velocity prior to the mechanical tests, and from recordings of acoustic emissions during loading (NA means that the data are not available for the analysis).
Résultats des mesures de vitesse des ondes P et S avant les essais mécaniques, et des enregistrements d’émissions acoustiques pendant le chargement (NA signifie que les données ne sont pas disponibles pour l’analyse).
4 Application to the study of water weakening in chalks
Our new device was applied to the study of the mechanical strength of chalks under dry and wet conditions. Two different chalks were selected for this study: Obourg chalk outcrops in a quarry in Harmignies in the Mons area, whereas Ciply chalk was sampled in an underground quarry at La Malogne near Mons. The Obourg chalk is purely made of calcite and has a porosity of 43% on the average. The Ciply chalk has a more heterogeneous composition, with calcite as the major mineral but also with fluorapatite inclusions, and has a porosity of 39% on the average. For both chalks the grain size and pore size are very small, in the micrometer and sub-micrometer range, respectively (Geremia et00A0;al., 2021a). As several blocks of Obourg chalk were available at CYU, both the SCB and the SECRBB methods could be tested, giving us the opportunity to compare both methods on a single material Figure 5. Due to the soft nature of the rock, a hand saw of 0.6 mm thickness was used to create notches with length between 10 and 12.5 mm for SCB tests and ranging from 7.5 to 15 mm for SECRBB without any rupture of the sample prior the experiments. For the Ciply chalk, only SCB tests were done. Our objective was to quantify the weakening effect of water on the mechanical properties of both chalks through the measurement of KIC, therefore our data set includes measurements on dry samples (dried at 60 °C during 48 h prior testing) and on water-saturated samples (saturation under vacuum, same procedure as for porosity in Sect. 3.1).
Table 4 summarizes our results for both chalks and for each testing configuration, on dry and water-saturated samples. The first observation is that, as expected, chalks are much weaker than the crystalline rocks tested in the previous section, roughly by one order of magnitude or more.
For the dry Obourg chalk, the KIC values obtained with the SCB method range between 0.0641 and 0.0926 MPa m1/2 with an average value of 0.0803 ± 0.0096 MPa m1/2; using the SECRBB method, the results are in the same order but higher, with KIC values ranging from 0.101 to 0.136 MPa m1/2 with an average value of 0.117 ± 0.014 MPa m1/2. For the water-saturated Obourg chalk, the KIC values (SCB method) are significantly lower than for the dry rock, ranging between 0.0449 and 0.0647 MPa m1/2 with an average value of 0.0521 ± 0.0069 MPa m1/2. Therefore, a reduction of almost 43% in fracture toughness is observed for the water-saturated compared to the dry chalk. This strong reduction can also be characterized by the so-called “wet-to-dry ratio” (Geremia et00A0;al., 2021b), with KIC(sat)/KIC(dry) = 0.65 for Obourg chalk. Figure 6 presents the histograms of the measured values for Obourg chalk depending on the test configuration and state of saturation, highlighting the impact of water but also of the experimental technique used to get the mode I fracture toughness.
For the Ciply chalk, the number of tested samples was smaller due to lack of material, so that, unlike Obourg chalk, no intent was made to build the corresponding histograms for the dry and water-saturated rocks. For the same reason only SCB tests were conducted. The KIC values for the dry Ciply chalk range between 0.0378 and 0.0417 MPa m1/2 with an average value of 0.0479 ± 0.0142 MPa m1/2. For this particular data set the dispersion is quite high, with a coefficient of variation equal to almost 30% which is about the double of all the other sample sets, probably reflecting the heterogeneous nature of Ciply chalk (Geremia et00A0;al., 2021b). The water-saturated Ciply chalk has a lower fracture toughness, ranging between 0.0239 and 0.0314 MPa m1/2 with an average value of 0.0287 ± 0.0042 MPa m1/2 corresponding to a decrease of about 50% with respect to the dry rock. The “wet-to-dry” ratio for Ciply chalk is 0.60, a manifestation of the strong weakening effect of water in Ciply chalk, as was also observed in Obourg chalk.
Sample properties, SCB testing parameters and experimental results for the estimation of the mode I fracture toughness in Obourg and Ciply chalks samples.
Propriétés des échantillons, paramètres des essais SCB et résultats expérimentaux pour l’estimation de la ténacité en mode I dans les craies d’Obourg et de Ciply.
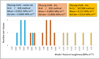 |
Fig. 6 Histogram of mode I fracture toughness values for dry and water-saturated Obourg chalk samples tested either using the SCB method or the SECRBB method. (a) Histogramme des valeurs de ténacité en mode I pour des échantillons de craie d’Obourg secs et saturés en eau, testés en mode SCB ou en mode SECRBB. |
5 Discussion
With the aim to test and validate a new experimental device for determining the mode I fracture toughness of rocks at CYU, a set of measurements was obtained on both crystalline and sedimentary rocks. Two types of tests can be conducted on the same device, the SCB test using half cylinders with a small thickness, and the SECRBB using long cylinders. Common features in both tests are that (i) for both types of samples, a notch needs to be created to “guide” the initiation of fracture propagation, and (ii) the samples are subjected to a three-point load on a uniaxial loading frame, making the samples to bend and a fracture to propagate from the notch tip where stress concentration will develop. In the following we will discuss the relevance of the validation tests, the comparison of results obtained with both types of tests on a single material, and the specific impact of water on the fracture toughness of chalks.
5.1 Comparison with published results
Our strategy to validate the apparatus was firstly to test two igneous rocks with known properties. Using the SCB configuration only, we found for the Aue granite KIC = 0.99 ± 0.10 MPa m1/2 which is smaller than the value 1.60 ± 0.13 MPa m1/2 reported by Backers (2004). In an unpublished data compilation on mechanical properties of granites from the Erzgebirge (Wolgast and Konietzky, 2013), two different values for the fracture toughness of the Aue granite (called Eibenstock in the report) are given, 0.81 MPa m1/2 when measured with the notched Brazilian test, and 1.50 MPa m1/2 when measured with the chevron bend test. These values, especially the first one, are closer to our results. For the Äspö diorite, with the SCB method as well, we found KIC = 1.84± 0.08 MPa m1/2 which is significantly lower than the 3.8 ± 0.1 MPa m1/2 value reported in Staub et00A0;al. (2004). In a sense our validation objective was not completely fulfilled, although some explanations can be found for that. Indeed, there is a consistent trend in the fact that our apparatus leads to lower values for the tested hard rocks. Nevertheless, the material from which we prepared our samples might be different from the ones in the published studies, in terms of mineralogical composition, porosity or grain size; in addition, the methods used in those tests are not always the same as ours as will be discussed in the next section.
For the Obourg chalk, few experimental works have been dedicated to the fracture toughness characterization. Brevik (2016) conducted measurements of KIC on dry Obourg chalk (called Mons chalk therein) by means of the Chevron bending test and found a value of 0.091 ± 0.022 MPa m1/2 and 0.134 ± 0.027 MPa m1/2 on samples with 40- and 50 mm diameter respectively, which compared to our results of 0.0803 ± 0.0096 MPa m1/2 on 25- and 40 mm diameter samples, suggests the good accuracy of our device.
A possible issue is the estimation of the stress intensity factor Y (Eq. (2)) or Y’ (Eq. (4)) needed to get the fracture toughness (Eqs. (1) and (3)). Indeed, different definitions can be found for the SCB stress intensity factor (Kuruppu and Chong, 2012) and those are usually obtained from finite element calculations, assuming that the material is homogeneous and isotropic. In the case of heterogeneity and/or anisotropy (Lee et00A0;al., 2014), the estimation of the fracture toughness with the mentioned equations might not be correct, which makes the comparison between different studies more difficult. For the Aue granite, heterogeneity is clearly visible at the scale of the semi-circular sample shown in the picture of Figure 3.
5.2 Influence of the testing configuration
In the published studies on Aue granite and Äspö diorite, a different method has been used by Backers (2004) and Staub et00A0;al. (2004), the Chevron Bend test: the principle of this test is similar to the SECRBB test, the samples are long cylinders but the shape of the notch is different (V-shaped). Similarly, Iqbal and Mohanty (2007) found a 50% discrepancy for KIC measured with the Chevron Bend test compared to the notched Brazilian test, the former being larger than the latter. In the compilation by Wolgast and Konietzky (2013) mentioned in the previous section, KIC measured with the Chevron Bend method was 60% higher than the one resulting from the notched Brazilian test in Aue granite. In our measurements on the Obourg chalk, we found that the SECRBB fracture toughness was higher than the SCB one: this general trend might explain as well part of the discrepancy between our measurements and the published data. Indeed, there is a clear trend in the fact that KIC measurements on long cylinders, either with straight (SECRBB) or chevron (CB) notches, are higher than when measured with more compact geometries, either semi-circular (SCB) or notched Brazilian (CCNBD) samples. The discrepancy between different methods could be linked to the difference in sample geometry and/or sample volume, a key point being that the volume should always be larger than the representative elementary volume (Guéguen and Palciauskas, 1994). For SCB tests, the following criterion must be verified (Kuruppu et00A0;al., 2014):
 (5)
(5)
where σT is the tensile strength of the material: for the tested rocks, the tensile strengths are 8, 15, 0.87 and 0.75 MPa for Aue granite, Äspö diorite (Backers, 2004), Obourg chalk and Ciply chalk (Geremia et00A0;al., 2021b), respectively. For the crystalline rocks, the minimum diameter given by equation 5 is about 30 mm, a value lower than the actual diameter (Table 2) of Aue granite samples (50 mm) and Äspö diorite (100 mm). For the chalks, the minimum diameter is 17 mm for Obourg and 8 mm for Ciply, values much lower than the nominal diameter (Table 4) of the tested samples (50 mm). As equation 5 is verified for all our SCB tests, we conclude that the experiments were done under optimum conditions with respect to the sample size.
However, the International Society of Rock Mechanics suggests also that the sample size should correspond to a minimum of 10 grain diameters to obtain a significant result. This might not be the case for the Aue granite samples (Fig. 3). Therefore, the results obtained on AGR samples suffer from grain heterogeneity and show tortuous fracture path (Fig. 3) compared with what would be obtained with larger scale specimen having more grains along the future fracture path. The AGR specimens tested in this study are probably affected by single mineral grain properties or moduli mismatch along grain boundaries. A double size specimen would result in more consistent fracture toughness values, resulting in smaller standard deviations. Less tests would be required for larger size specimens to obtain an appropriate toughness value.
For the hard rocks, ultrasonic sensors were installed on the tested samples to monitor the evolution of the P-wave velocity and to record the acoustic emission activity. The velocity recordings were not conclusive, no significant change in velocity was observed during loading even close to the fracturing. A possible problem might be that the recording rate (one measurement every 35 seconds, Fig. 4) is too large to grab fast changes in the material properties when the fracture propagation starts. Indeed, the acoustic emission activity recordings (Fig. 4) show that a surge in AE occurs once the load exceeds on the average 86% (Äspö) and 93% (Aue) of the failure load (Tab. 3). Therefore, the time window is very narrow and probably too small compared to our velocity sampling rate. Qualitatively our AE activity evolution is in agreement with the results published by Muñoz-Ibáñez et00A0;al. (2021) on SCB tests conducted on sandstones. Recording acoustic emissions is a powerful tool which allows also to locate the AEs provided that the number of sensors is high enough (Xu et00A0;al., 2016b), which was not the case in our study. Using an array of 8 sensors in SCB tests, Guo et00A0;al. (2021) and Muñoz-Ibáñez et00A0;al. (2021) were able to track the cracking activity and the propagation of the fracture. Such studies provide a good knowledge on the characteristics of the process zone which develops ahead of a fracture tip as shown by Zang et00A0;al. (2000) in uniaxial tests conducted on Aue granite.
5.3 Impact of water weakening on fracture toughness
When comparing the fracture toughness of water saturated and dry chalk samples, our results show that  is significantly smaller than
  both for Obourg chalk (43% decrease) and Ciply chalk (50% decrease). Keeping in mind the former discussion on the effect of sample geometry and methodology, this result is a robust one, as we used the same device and methodology in our tests on the dry and water-saturated samples. Water weakening has a significant impact on the mode I fracture toughness, as well as on other mechanical properties for the tested chalks (Geremia et00A0;al., 2021b). As the fracture toughness is directly linked to the surface energy (Tromans and Meech, 2002), related to the work necessary to cut a solid body in two halves, our data set suggests that the nature of the weakening needs to be found in the surface energy reduction in presence of water. For the tested chalks, this has been discussed in our previous work (Geremia et00A0;al., 2021b) in which independent measurements of surface energy were provided. Such a weakening mechanism induced by water or vapor pressure has been observed in other studies on the fracture toughness of sandstones (Noël et00A0;al., 2021) and anisotropic hard rocks (Kataoka et00A0;al., 2015).
6 Conclusion
In order to test a newly built experimental device for mode I fracture toughness estimation, a set of measurements on two hard rocks, the Aue Granite and the Äspö Diorite, and two chalks from the Paris basin, Obourg and Ciply chalks, is presented. The apparatus is versatile, as it allows for the determination of KIC with two different testing procedures, the Semi-Circular Bend (SCB) and the Straight Edge Cracked Round Bar Bend (SECRBB) methods. Compared to other methods, SCB and SECRBB are interesting for the easiness of the notched sample preparation. For the SCB tests, a pair of ultrasonic sensors were installed at the sample surface to monitor variations in P-wave velocity and to record the acoustic emission activity. A surge in AE activity is almost systematically observed when the applied load is higher than about 80% of the failure load. Our results are in reasonably good agreement with published data on the same rocks. When both methods could be tested on the same material, our results show that the SECRBB test provides values of the fracture toughness 37% higher compared to the SCB test. This discrepancy may be explained by a sample size effect. One unexpected conclusion of this work is that fracture toughness measurements seem to be very sensitive to the methodology employed in the tests, which would need a deeper investigation beyond the scope of the present work. The experiments on chalks showed that the fracture toughness of water saturated chalks is almost half that of the dry chalks. Our data set on water-saturated and dry chalks provided useful information regarding the process of weakening, showing that fracture toughness is a valuable parameter to assess the importance of water weakening.
Acknowledgments
It is our privilege to dedicate this work to the memory of the late Pierre Berest who was an inspiring person for all the people working in rock mechanics. We thank Pascal Le Roux and workers at the ARM (Sysax group) company for building the new apparatus. Some of the measurements were done by Rachid Ismail during a Master 2 internship at CYU. The hard rock cores were provided by GFZ Potsdam, and the chalk blocks were kindly made available by Sara Vandycke, Fanny Descamps and Damien Bury at UMons within the framework of the GEOFRISK research program funded by CY Initiative.
Conflicts of interest
The authors have no conflicts of interest to declare.
References
- Backers T. 2004. Fracture Toughness Determination and Micromechanics of Rock Under Mode I and Mode II loading [GFZ Potsdam, Germany]. PhD Thesis https://doi.org/10.2312/GFZ.b 103-05055 [Google Scholar]
- Backers T, Fardin N, Dresen G, Stephansson O. 2003. Effect of loading rate on Mode I fracture toughness, roughness and micromechanics of sandstone. Int J Rock Mech Mining Sci 40: 425–433. [CrossRef] [Google Scholar]
- Brevik NO. 2016. Experimental Study of Fracture Toughness in Sedimentary Rocks. Master thesis. NTNU, Norway. xx [Google Scholar]
- Chung J, Lee H, Kwon S. 2019. Numerical investigation of radial strain ‑ controlled uniaxial compression test of Äspö Diorite in grain‑based model. Rock Mech Rock Eng 52: 3659–3674. [CrossRef] [Google Scholar]
- Fowell RJ, Hudson JA, Xu C, Chen JF, Zhao X. 1995. Suggested method for determining mode I fracture toughness using Cracked Chevron Notched Brazilian Disc (CCNBD) specimens. Int J Rock Mech Mining Sci 32: 57–64. [CrossRef] [Google Scholar]
- Geremia D, David C, Descamps F, Menéndez B, et00A0;al. 2021a. Water-induced damage in microporous carbonate rock by low-pressure injection test. Rock Mech Rock Eng 1: 3. [Google Scholar]
- Geremia D, David C, Ismail R, El Haitami A. 2021b. An integrated study of water weakening and fluid rock interaction processes in porous rocks: linking mechanical behavior to surface properties. Appl Sci 11: 11437. [CrossRef] [Google Scholar]
- Guéguen Y, Palciauskas V. 1994. Introduction to the physics of rocks. Princeton University Press. xx [Google Scholar]
- Guo TY, Wong LNY, Wu Z. 2021. Microcracking behavior transition in thermally treated granite under mode I loading. Eng Geol 282: 105992. [CrossRef] [Google Scholar]
- Haberfield CM, Johnston IW. 1990. Determination of the fracture toughness of a saturated soft rock. Can Geotech J 27: 276–284. [CrossRef] [Google Scholar]
- Iqbal MJ, Mohanty B. 2007. Experimental calibration of ISRM suggested fracture toughness measurement techniques in selected brittle rocks. Rock Mech Rock Eng 40: 453–475. [CrossRef] [Google Scholar]
- Kataoka M, Obara Y, Kuruppu M. 2015. Estimation of fracture toughness of anisotropic rocks by semi-circular bend (SCB) tests under water vapor pressure. Rock Mech Rock Eng 48: 1353–1367. [CrossRef] [Google Scholar]
- Kuruppu MD, Chong KP. 2012. Fracture toughness testing of brittle materials using semi-circular bend (SCB) specimen. Eng Fract Mech 91: 133–150. [CrossRef] [Google Scholar]
- Kuruppu MD, Obara Y, Ayatollahi MR, Chong KP, Funatsu T. 2014. ISRM-suggested method for determining the mode I static fracture toughness using semi-circular bend specimen. Rock Mech Rock Eng 47: 267–274. [CrossRef] [Google Scholar]
- Lee HP, Olson JE, Holder J, Gale JFW, Myers RD. 2014. The interaction of propagating opening mode fractures with preexisting discontinuities in shale. J Geophys Res 120: 169–181. [Google Scholar]
- Muñoz-Ibáñez A, Delgado-Martín J, Herbón-Penabad M, Alvarellos-Iglesias J. 2021. Acoustic emission monitoring of mode I fracture toughness tests on sandstone rocks. J Petroleum Sci Eng 205: 108906. [CrossRef] [Google Scholar]
- Nasseri MHB, Mohanty B, Young RP. 2006. Fracture toughness measurements and acoustic emission activity in brittle rocks. Pure Appl Geophys 163: 917–945. [CrossRef] [Google Scholar]
- Noël C, Baud P, Violay M. 2021. Effect of water on sandstone’s fracture toughness and frictional parameters: brittle strength constraints. Int J Rock Mech Mining Sci 147: 104916. [CrossRef] [Google Scholar]
- Ouchterlony F. 1989. On the background to the formulae and accuracy of rock fracture toughness measurements using ISRM standard core specimens. Int J Rock Mech Geomech Abst 26: 13–23. [CrossRef] [Google Scholar]
- Staub I, Andersson JC, Magnor B. 2004. Äspö Pillar Stability Experiment. SKB Report. xx [Google Scholar]
- Sun Z, Ouchterlony F. 1986. Fracture toughness of Stripa Granite cores. Int J Rock Mech Min Sci Geomech Abstr 23: 399–409. [CrossRef] [Google Scholar]
- Tromans D, Meech JA. 2002. Fracture toughness and surface energies of minerals: theoretical estimates for oxides, sulphides, silicates and halides. Miner Eng 15: 1027–1041. [CrossRef] [Google Scholar]
- Wolgast D, Konietzky H. 2013. Internal report (unpublished) on the petrophysical and mechanical properties of granites from Erzgebirge, Germany. Institut für Geotechnik, Freiberg. [Google Scholar]
- Xu Y, Dai F, Zhao T, Xu N wen, Liu Y. 2016. Fracture toughness determination of cracked chevron notched Brazilian disc rock specimen via Griffith energy criterion incorporating realistic fracture profiles. Rock Mech Rock Eng 49: 3083–3093. [CrossRef] [Google Scholar]
- Zang A, Wagner FC, Stanchits S, Janssen C, Dresen G. 2000. Fracture process zone in granite. J Geophys Res: Solid Earth 105: 23651–23661. [CrossRef] [Google Scholar]
Cite this article as: Christian David, Davide Geremia, Adilbek Zhengissov, Arno Zang. A versatile device for measuring the mode I fracture toughness with application to estimate the impact of water weakening in chalks. Rev. Fr. Geotech. 2023, 177, 5.
All Tables
Recommended geometrical dimensions of SCB and SECRBB tests (after (Kuruppu et00A0;al., 2014).
Valeurs recommandées pour les dimensions des échantillons pour les tests SCB et SECRBB (d’après (Kuruppu et00A0;al., 2014).
Sample properties, SCB testing parameters and experimental results for the estimation of the mode I fracture toughness in Aue granite and Äspö diorite.
Propriétés des échantillons, paramètres des essais SCB et résultats expérimentaux pour l’estimation de la ténacité en mode I dans le granite d’Aue et la diorite d’Äspö.
Results from measurements of P and S-waves velocity prior to the mechanical tests, and from recordings of acoustic emissions during loading (NA means that the data are not available for the analysis).
Résultats des mesures de vitesse des ondes P et S avant les essais mécaniques, et des enregistrements d’émissions acoustiques pendant le chargement (NA signifie que les données ne sont pas disponibles pour l’analyse).
Sample properties, SCB testing parameters and experimental results for the estimation of the mode I fracture toughness in Obourg and Ciply chalks samples.
Propriétés des échantillons, paramètres des essais SCB et résultats expérimentaux pour l’estimation de la ténacité en mode I dans les craies d’Obourg et de Ciply.
All Figures
|
Fig. 1 Sample geometry for the SCB and SECRBB tests using both a three-point loading configuration. Géométrie des échantillons pour les essais SCB et SECRBB utilisant tous les deux un chargement en trois points. |
| In the text | |
|
Fig. 2 (a) sketch of the newly developed device at CYU in the SECRBB test configuration. (b) photograph of the experimental setup in the SCB configuration with an Aue granite sample. (a) schéma du nouveau dispositif développé à CYU dans la configuration SECRBB. (b) photo du dispositif expérimental en configuration SCB avec un échantillon de granite d’Aue. |
| In the text | |
|
Fig. 3 (a) Histogram of mode I fracture toughness values for the Aue granite and the Aspö diorite. (b) Photograph showing a tested Aue granite sample with two P-wave ultrasonic sensors for active and passive acoustic monitoring. c) Closer view of the fracture ahead of the notch. (a) Histogramme des valeurs de ténacité en mode I pour le granite d’Aue et la diorite d’Aspö. (b) Photographie montrant un échantillon de granite d’Aue avec deux capteurs ultrasoniques d’onde P pour le monitoring actif et passif. c) Vue détaillée de la fracture partant de l’extrémité de l’entaille. |
| In the text | |
|
Fig. 4 Example of loading curve, recording of acoustic emission activity and evolution of normalized P-wave velocity VP/VPo for selected samples (a) Aue granite sample AGR2 and (b) Äspö diorite sample ADR1. The horizontal dashed lines correspond to VP/VPo =1. Exemple de courbe de chargement, d’enregistrement d’émissions acoustiques et d’évolution de la vitesse d’onde P normalisée VP/VPo pour des échantillons choisis (a) pour le granite d’Aue AGR2 et (b) pour la diorite d’Äspö ADR1. Les lignes horizontales en pointillés correspondent à VP/VPo =1. |
| In the text | |
|
Fig. 5 Some of the Obourg chalk samples used for SCB and SECRBB tests. Quelques échantillons de craie d’Obourg qui ont été testés dans les essais SCB et SECRBB. |
| In the text | |
|
Fig. 6 Histogram of mode I fracture toughness values for dry and water-saturated Obourg chalk samples tested either using the SCB method or the SECRBB method. (a) Histogramme des valeurs de ténacité en mode I pour des échantillons de craie d’Obourg secs et saturés en eau, testés en mode SCB ou en mode SECRBB. |
| In the text | |
Current usage metrics show cumulative count of Article Views (full-text article views including HTML views, PDF and ePub downloads, according to the available data) and Abstracts Views on Vision4Press platform.
Data correspond to usage on the plateform after 2015. The current usage metrics is available 48-96 hours after online publication and is updated daily on week days.
Initial download of the metrics may take a while.