")
")
| Issue |
Rev. Fr. Geotech.
Number 177, 2023
Hommage à Pierre Bérest
|
|
|---|---|---|
| Article Number | 4 | |
| Number of page(s) | 20 | |
| DOI | https://doi.org/10.1051/geotech/2024019 | |
| Published online | 23 avril 2024 | |
Article de recherche / Research Article
How the Earth’s upper crust deforms in a viscous or brittle manner and how these behaviors interact and evolve over time: the crucial role of pressure solution creep and sealing processes1
Comment la croûte supérieure de la Terre se déforme de manière visqueuse ou cassante et comment ces comportements interagissent et évoluent dans le temps : le rôle crucial des processus de fluage et de colmatage par pression solution
1
ISTerre, University Grenoble Alpes, Grenoble INP, University Savoie Mont Blanc, CNRS, IRD, University Gustave Eiffel, Grenoble, France
2
Honorary Professor of the University Grenoble Alpes, Grenoble, France
* Corresponding author: Cette adresse e-mail est protégée contre les robots spammeurs. Vous devez activer le JavaScript pour la visualiser.
Abstract
Observations of the geological deformation of the Earth’s upper crust show both brittle behavior (faults) and viscous behavior (folds, shear zones). This paper explains the crucial role of pressure solution creep and sealing processes in these contrasting behaviors and in their evolutions over time. A description of natural deformation by pressure solution shows that the pressure solution creep process can accommodate large ductile deformation without any faults. This process can also accommodate near-stable ductile deformation through the coupling of pressure solution and fracturing. Even if pressure solution creep cannot accommodate the tectonic loading rate and earthquakes consequently occur, the post-seismic evolution is largely controlled by pressure solution processes such as post-seismic creep and fault healing and sealing. Some key experiments are presented that allow evaluating the thermodynamics and kinetics of these processes. Various models are then presented that could help engineers integrate pressure solution creep and sealing processes into predictions of the long-term behavior of rock deformation in underground storage and geo-energy facilities.
Résumé
Les observations de la déformation géologique de la croûte terrestre supérieure montrent à la fois un comportement fragile (failles) et un comportement visqueux (plis, zones de cisaillement). Cet article explique le rôle crucial du fluage et du colmatage par pression solution dans ces comportements contrastés et dans leur évolution au cours du temps. Une description de la déformation naturelle par pression solution montre que le processus de fluage par pression solution peut accommoder une importante déformation ductile sans aucune faille. Ce processus peut également accommoder une déformation ductile quasi stable grâce au couplage de la pression solution et de la fracturation. Même si le fluage par pression solution ne peut pas s’adapter au taux de chargement tectonique et qu’en conséquence des tremblements de terre se produisent, l’évolution post-sismique est largement contrôlée par les processus de la pression solution tels que le fluage post-sismique et la cicatrisation et le colmatage des failles. Quelques expériences clés sont présentées qui permettent d’évaluer la thermodynamique et la cinétique de ces processus. Différents modèles sont ensuite présentés qui pourraient aider les ingénieurs à intégrer les processus de fluage et de colmatage par pression solution dans les prévisions du comportement à long terme de la déformation des roches dans les installations souterraines de stockage et de géo-énergie.
Key words: pressure solution creep / fault healing and sealing / upper crust deformation / underground storage / geo-energy facilities
Mots clés : fluage par pression solution / cicatrisation et colmatage des failles / déformation de la croûte supérieure / stockage souterrain / installations géo-énergétiques
Publisher note: Following the publication of the Erratum, the article has been corrected on 16 October 2024.
© CFMS-CFGI-CFMR-CFG, 2023
1 Introduction
The Earth is a dynamic planet (Fig. 1a). In the context of underground storage and geo-energy facilities in the upper part of its crust, any storage, injection or extraction of a solid, fluid or gas induces deformation in the short term (days or months) and long term (years or centuries) as for example human-induced earthquakes (Foulger et al., 2018). Laboratory experiments and observations of natural deformation in such contexts reveal both brittle behavior (Byerlee, 1978; Paterson, 1978) and viscous behavior (Gratier and Gamond, 1990; Rutter, 1983; Urai et al., 1987). It is hence necessary to gain a more thorough understanding of the conditions of development of these two mechanisms of rock deformation. The aim of this special issue paying tribute to Pierre Berest, a pioneer in the measurement and modeling of very slow deformations associated with the extraction or storage of gas, fluid or solid at depth (Berest et al., 2005; Berest et al., 2023), is to help predict the mechanical behavior of underground and geo-energy facilities by analyzing the mechanics of the Earth’s upper crust, deduced from its behavior in geological (Hobbs et al., 1976; Ramsay, 1967) and geotechnical conditions (Cosgrove and Hudson, 2016).
The first part of this paper describes the partition between viscous and brittle behaviors in the deformation of the Earth’s upper crust, including the crucial role of pressure solution creep and sealing processes. It is shown that this partition depends mainly on the composition and microstructure of the rocks. The paper then presents various experiments that allow evaluating the thermodynamics and kinetics of pressure solution processes and their interaction with fracturing processes. Lastly, it suggests various models that can be used to predict the interactions between viscous and brittle behaviors and their evolution over time, for various types of rocks and in various conditions of underground rock deformation in storage and geo-energy facilities.
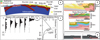 |
Fig. 1 (a) Dynamics of the Earth. (b) Distribution of earthquakes through the upper crust in western USA; (c) strength versus depth model for quartz-bearing and feldspathic rocks (Sibson, 1982). (d) Folds and faults in cross sections through mountain ranges, (Pfiffner, 2017). (e) Fold and fault coupled development (Suppe, 1985). Dynamique de la Terre. (b) Distribution des tremblements de terre dans la croûte supérieure de l’ouest des États-Unis ; (c) modèle de résistance en fonction de la profondeur pour les roches quartzifères et feldspathiques (Sibson, 1982). (d) Plis et failles dans des coupes transversales de chaînes de montagnes, (Pfiffner, 2017). (e) Développement couplé de plis et de failles (Suppe, 1985). |
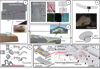 |
Fig. 2 Pressure solution markers in flexural folds: (a) cross section through the Western Alps; (b) pitted pebbles; (c) tectonic stylolites and veins with Al, Si and Ca distribution contents; (d) mineral fibers and slickolites along sliding fault or strata; (e) pressure solution at micro blocks scale in flexural folding with example from the Western Alps. (f) Finite displacements field associated with folds and faults of the Transverse Ranges (California), with detail to the left, evaluated from unfolding methods (Gratier et al. 1999a, Thibert et al. 2005). Marqueurs de pression solution dans les plis flexuraux : (a) coupe transversale à travers les Alpes occidentales ; (b) galets impressionnés ; (c) stylolites et veines tectoniques avec distributions des teneurs en Al, Si et Ca ; (d) fibres minérales et slickolites le long des glissements de failles ou de strates ; (e) pression solution à l’échelle des micro-blocs dans les plis flexuraux avec exemple des Alpes occidentales. (f) Champ de déplacements finis associés aux plis et aux failles des Transverse Ranges (Californie), avec détail à gauche, évalués à partir de méthodes de dépliage (Gratier et al. 1999a, Thibert et al. 2005). |
2 Mechanisms of deformation of the Earth’s upper crust
The first observation to be made is that earthquakes occur almost everywhere in the upper crust, as attested by their locations in the western part of the United States (Sibson, 1982), Figure 1b. This brittle deformation, which is controlled by friction (Byerlee, 1978; Scholtz, 1998), disappears at depths below 10-15 km due to the plastic flow of the lower crust controlled by dislocation glide and associated with crystal reorientations (Poirier, 1985). This is summarized by the plot of crust strength versus depth that associates these two mechanisms and leads to the well-known Christmas tree shape (Chen and Molnar, 1983; Sibson, 1982), Figure 1c. The problem is that geological observations reveal this model to be wrong, or at least incomplete, for a large part of the Earth’s upper crust. For example, geological sections through various mountain ranges show that a large proportion of upper crust deformation is accommodated by various types of fold, so by ductile processes (Pfiffner, 2017) (Fig. 1d). Ductile folding and shearing are described throughout the upper and middle crust (Hobbs et al., 1976; Ramsay, 1967). The first issue is, therefore, to identify these mechanisms of ductile deformation. Moreover, folds and faults may develop in parallel (Suppe, 1985) (Fig. 1e), so another issue is how these brittle and ductile mechanisms interact and evolve over time in upper crust deformation.
The term “ductility” can apply to various mechanisms of deformation: (i) crystal plasticity, which occurs in rock deformation above a critical temperature (Poirier, 1985), (ii) cataclastic flow, which can occur in poorly consolidated sediments or along some active faults (Chen and Spiers, 2016; Scholtz, 1998) and (iii) pressure solution creep, which is controlled by stress-driven mass transfer in the presence of soluble minerals (Elliott, 1973; Rutter, 1983). Crystal plasticity is strongly temperature-dependent and so mainly limited to the lower crust, below a 10-15 km depth (Poirier, 1985), except for salt rocks deformation (Berest et al., 2023) and will not be discussed here. Cataclastic flow is controlled by frictional stability, which depends on friction parameters defined as velocity dependence of steady-state friction (Scholtz, 1998); earthquakes only develop with velocity-weakening behavior, whereas velocity-strengthening behavior is intrinsically stable, preventing earthquake nucleation. Minerals with very low friction coefficient, such as clays or talc, exhibit stable, velocity strengthening slip behavior over a wide range of conditions relevant to the upper crust ((Den Hartog et al., 2012; Moore and Lockner, 2007; Moore and Rymer, 2007). Other minerals, and more generally rocks with various mineral composition, only show velocity strengthening friction when dilatant granular flow is easy so in poorly consolidated rocks. When the rocks are more compacted, or when dilatation is more difficult, there is a competition between rate-sensitive ductile deformation at grain scale and rate-insensitive frictional sliding between grains (Chen and Spiers, 2016; Niemeijer and Spiers, 2007; Rutter and Mainprice, 1979; Verberne et al., 2020). If a rate-sensitive process cannot accommodate the deformation at grain scale then frictional sliding deformation develops with unstable velocity weakening friction hence seismogenic fault-slip behavior or shear rupture in the lab. If the rate-sensitive deformation is efficient enough ductile deformation dominate. Various examples given below show that the main mechanism of such a ductile behavior in fold development and creep processes along faults in the upper and middle crust is pressure solution creep which is a rate-sensitive process (Elliott, 1973; Rutter, 1976; Weyl, 1959) and which is also a sealing mechanism that plays a key role in post-seismic healing of faults (Gratier and Gueydan, 2007; Renard et al., 2000). The aim of this paper is to describe the characteristics of these mechanisms of pressure solution creep and sealing processes particularly to identify the main parameters that control the thermodynamics and the kinetics of these processes. These pressure solution processes will be presented in three parts: (i) observation in the upper crust, (ii) experimental approach, and (iii) modeling for various rocks.
3 Natural pressure solution in the Earth’s upper crust
Evidence of pressure solution controlling the deformation of the Earth’s upper crust is seen in the field and under different types of microscope through observations of various microstructures that reflect stress-driven mass transfer in solution. These markers of pressure solution are presented here in three examples illustrating the diverse nature of these microstructures. The markers are associated with the development of two types of fold: flexural slip folds, often associated with faults (Fig. 2), and similar folds with axial plane cleavage and no faults (Fig. 3). Pressure solution markers of both creep and sealing processes are also discussed here using another example (Fig. 4), along the North Anatolian fault (Turkey), which shows both seismic and aseismic behavior.
The two examples of folds are described on a regional cross section of the Western Alps (Figs. 2 and 3). A green dashed line indicates the present-day erosion surface, where the different types of fold are outcropping. On these cross sections (Figs. 2a and 3a) the sedimentary cover at the time of the deformation (about 10 to 20 My ago) is also added in order to visualize the various depths during the development of the pressure solution processes. These depths range from near 0 to 10 km, based on the reconstruction of the deformation conditions (Gratier et al., 2013a).
3.1 Pressure solution in flexural slip folds
Markers of pressure solution creep that develop at minimum depths and are associated with the development of gentle folds are limestone pitted pebbles in Miocene conglomerates deformed very near the surface at a depth of less than one kilometer (Fig. 2b). Centimeter to decimeter-sized limestone pebbles were dissolved under alpine tectonic compressive stress (near E-W in this region with near N-S fold axes), and this dissolution is always associated with a network of fractures filled through the deposition of the dissolved species (Gratier et al., 1999b; McEwen, 1978).
Other common markers of stress-driven mass transfer are tectonic stylolites (Toussaint et al., 2018), also in limestones (Fig. 2c). Element distribution maps show the total dissolution of the soluble species, here Ca in the stylolite seams. This stress-driven dissolution of calcite is associated with passive concentration of the insoluble species also contained in the rock in very low percentages, such as phyllosilicates in this case. This is indicated by an increase in the concentration of Al and Si in the stylolite seam. It must be noted that the stylolite process in this case is a trans-granular dissolution affecting mainly monomineralic rocks with mostly soluble grains of calcite of various sizes (Fig. 2c-center). As for the pitted pebbles described above, this dissolution is always associated with a network of fractures filled through the deposition of the dissolved species (then called veins), Figure 2c-left. Calcite twinning is also seen in deformed limestones, however accommodating only a small part of the deformation (Burkhard, 1992). The stylolite peak lengths indicate the minimum finite displacement of the two blocks in contact. Apparent shift of veins (Fig. 4b) or passive concentration of insoluble species (Fig. 3b) also allow evaluating the dissolution (Gratier et al., 2013a). Stylolite peaks can be considered as parallel to the maximum compressive stress in co-axial deformation or to successive stress increments in non-coaxial deformation. Stylolites associated with perpendicular veins accommodate the flattening of the rock (Fig. 2e). Stylolites and veins may also be seen in prolongation of each other indicating the rotation of micro blocks accommodating folding processes (Fig. 2e).
The last type of pressure solution creep markers that can be seen associated with flexural folds is dissolution features that allow two blocks of rock to slide either along the strata or along faults of various types such as reverse and strike slip faults that develop before, during or after the folding process (Fig. 2a). These markers are usually seen only as fibers of the minerals, which are the soluble (mobile) species (Andreani et al., 2005). The process is as follows (Fig. 2d): when two blocks are locked together, dissolution may occur on the asperities of the surface opposing the sliding, allowing aseismic sliding controlled by the rate of dissolution of the asperities (Rutter and Mainprice, 1978). These structures are named slickolites. The soluble species diffuse along the fault surface and recrystallize nearby as mineral fibers in the space opened by the micro-displacement caused by dissolution of the asperities (Fig. 2d). When the upper part is eroded, the pack of fibers can be seen, and indicates by its characteristic shape the direction and the sense of sliding. This is the most reliable marker of the sense of sliding on strata or faults available in the field. A detailed examination often reveals a mixture of two types of crystallization within the pack of fibers. One of these is a near-continuous dissolution and re-deposition process described as the crack seal process (Ramsay, 1980), and it is a marker of pressure solution creep. The other type is seen in the form of euhedral crystals, reflecting crystal growth in free fluid due to the rapid opening of voids in the case of fast (seismic) fault sliding. This occurs if the rate of asperities dissolution is unable to accommodate the stress loading rate and, consequently, when asperities are seismically broken (Gratier and Gamond, 1990). The pack of fibers may therefore sometime indicate successive seismic and aseismic displacements.
Three types of pressure solution structures around micro blocks, associated with flattening, rotation or sliding, are enough to accommodate the development of flexural slip folds (Fig. 2e). This folding may lead to relatively large strain values; for example, shortening of about 50% is shown here for the Tithonian formation along the Bes valley from Digne to Barles (Western Alps) folded at a geological strain rate of about ten to minus fifteen (Gidon, 1998).
Moreover, this flexural folding is associated with only minor internal deformation, usually with no significant change in the thickness of the folded strata. As there is no change of thickness it was suggested many years ago (Goguel, 1948) that these structures can be unfolded to test the compatibility between folding and fault development, a type of 3D method for balancing folded and faulted layers. An example shown here is of the restoration of the Transverse Ranges (California) that developed due to the conjugated displacement of the San Andreas right-lateral strike-slip fault and the Garlock left-lateral strike-slip fault (Fig. 2f). In this example, a thick sandstone layer that was folded and faulted without a significant change in thickness has been restored to its initial horizontal state (Gratier et al., 1999a). Part of the deformed area is given in the left part of Figure 2f showing the principle of the method with the deformed part (top) and the restored part (bottom) of some folded and faulted structures in the Ventura basin. The whole folded surface is cut into patches bounded by faults and connection lines (about 100 patches here). Unfolding may be done using one of two methods: either by modeling the folded surfaces with a network of rigid triangles that are laid flat and automatically best fitted (Gratier et al., 1991), or by directly interpolating the folded surface as a developable mesh that is then laid flat (Thibert et al., 2005). By comparing the deformed and undeformed structures, the finite displacement can be evaluated. When this is done for the Transverse Ranges in their entirety, the overall displacement field may be evaluated. This then reveals the very good compatibility between folds and faults, hence including aseismic folding and seismic faulting (Fig. 2f). This confirms that ductile folding controlled by pressure solution may develop with seismic faults.
To conclude, a characteristic of pressure solution creep in flexural slip folds is that the rocks are mainly monomineralic with mostly soluble grains of various sizes such as limestones, sandstones, and dolostones. Another typical feature is that this deformation is accommodated by dissolution-deposition around micro blocks of various sizes and always associated with fracturing, so there is a link with brittle processes. Lastly, although internal deformation of the rocks is always limited in flexural folds, global finite strain values may be quite large with this type of folds in stratified formations.
3.2 Pressure solution in similar folds with axial plan cleavage
Another type of folds may be seen with axial plane cleavage (Fig. 3a). There are in fact two types of cleavage, which can in some cases be associated. One is the spaced cleavage that develops at various depths from a couple of kilometers to more than 10 km in rocks such as shales or schists or even granites that are polymineralic with both soluble minerals such as calcite, quartz, dolomite and feldspar and insoluble minerals such as micas, chlorite and Fe-Ti oxides. Spaced cleavage can be seen around relatively rigid undeformed objects such as fossil fragments (Fig. 3b-left). An example is given in Figure 3b-right: by comparing the chemical compositions of the part of the rock matrix that has been exposed to maximum stress (through the indenting effect of the rigid object) and the part of the matrix that has been protected from stress in the pressure shadow of this rigid object, mass and volume changes can be calculated. The results show that phyllosilicates (muscovite, chlorite with Al, K, Mg, Fe) and Fe-Ti oxides are passively concentrated in the zones of maximum stress due to stress-driven dissolution of soluble minerals such as calcite, quartz, dolomite, and albite (Si, Ca, Mg, Na). The overall change in mass transfer ΔM/Mo is equal to (Ip /Ie − 1), Ip and Ie being the concentration of the insoluble minerals in the protected and exposed zones respectively. The overall mass variation is −0.87. The relative decrease in mass of each soluble mineral ΔMs /Mso is equal to (Ip /Ie) (Se / Sp) −1, Se and Sp being the concentrations of the soluble minerals in the exposed and protected zones respectively. These mass variations are equal to −0.95 for quartz and −0.91 for calcite. Therefore, in these conditions of about 200−300°C at a 5-8 km depth, calcite and quartz have about the same mobility under stress. This is not expected to be the case at lower temperatures (below 200°C) or higher temperature (above 300°) since the solubility of calcite and quartz varies inversely to temperature (Rutter, 1976). The cleavage spacing depends on the heterogeneity of the rocks (Fig. 3c), either initial or linked to their deformation as rigid objects or microfolds respectively, and it can evolve over time. Spaced cleavage indicating a planar decrease in volume usually develops perpendicularly to the maximum compressive stress; however, in the case of preexisting easily-reactive surfaces (cleavage, stratification) and/or of non-coaxial deformation, it may develop at smaller angle (60 to 90°) depending on the yield of sliding (Gratier and Vialon, 1980).
Another type of axial plane cleavage is known as slaty cleavage (Fig. 3b). It also develops in polymineralic rocks as shales and schists but it may be associated with very large deformation indicated by folded veins and truncated belemnites with elongation of 100-300% and shortening of 50-75% as shown on this example of the Oisans massif (France). However, these large strain values are not seen at grain scale where the grains are near equant when compared with the strain ellipse (Fig. 3d). These grains are also very small with a median size of a few microns. Therefore, the only explanation for this large deformation is grain sliding, as suggested in the case of superplastic flow (Ashby and Verrall, 1973). Grain sliding is accommodated by dissolution (dark gray) and by deposition (white), as shown on Figure 3e (Gratier et al., 2023). In this case pressure solution creep accommodates very large ductile deformation as a creep process without any faults.
To conclude on the folding mechanism with axial plane cleavage, in this case the deformed rocks are polymineralic with a mixture of fine soluble and insoluble grains such as marls, shales, slates or schists. Extensive ductile deformation occurs here without any fractures as a superplastic flow with major deformations accommodated at a geological strain rate of about ten to minus fourteen per second (Gratier et al., 2023). The coupling of spaced cleavage and grain boundary sliding (Fig. 3b) is also associated with the development of tectonic layering (Fig. 3c), which will be discussed with the presentation of an example of experimental rock layering in §4.7 (Gratier et al., 2015).
3.3 Pressure solution in creeping and seismic faults
Pressure solution creep associated with faults can also be discussed using the example of the North Anatolian fault (Turkey). Along this fault, with a displacement of about 80 km, there are both locked zones where large earthquakes initiate and interseismic creeping zones (Fig. 4a). The strain values associated with pressure solution through various markers have been calculated using these markers (Kaduri et al., 2019). In the locked zone (Fig. 4b), the rocks are massive limestones with only limited aseismic deformation and well developed sealing processes involving stylolites and veins with a maximum strain ellipse ratio of 1.3 and shear strain of 0.2, clearly resulting from successive events associated with post-seismic earthquake displacement (Cakir et al., 2003). In the interseismically deforming zones, a large deformed zone several kilometers wide can be seen with a strain ellipse ratio below 8.3 and shear strain of 2.7, Figure 4c. The deformation is due to pressure solution grain boundary sliding (Kaduri et al., 2019), and this damage zone contains some quite narrow gouges with decimeter-wide zones with cleavage that are almost parallel to the sliding, indicating very significant deformation with shear strain up to 100 (Fig. 4d). It is possible to evaluate the proportion of aseismic deformation in the total displacement. As can be seen on a representative outcrop of an exhumed recent creeping zone, the gouges represent only a small volume of the creeping zone: about 4% of a total shear zone several kilometers wide (Fig. 4e). It is possible to cumulate all these shear zones by gathering them together. This leads to a large zone several kilometers wide with relatively low shear strain and a narrow zone several meters wide with very large strain. The total ductile deformation accommodated by pressure solution is found to range from 10 to 50% of the total deformation depending on the rocks (Kaduri et al., 2019). The conclusion that can be drawn from this last example, which is backed up by other examples (Gratier et al., 2013b), is that there are two extreme types of behavior: firstly, rocks with mostly soluble grains of various sizes such as limestones, sandstones and dolostones, showing relatively minor internal pressure solution deformation with mostly seismic sliding and evidence of post-seismic pressure solution creep sealing processes, and, secondly, polymineralic rocks with fine soluble and insoluble grains such as marls, shales, slates, schists, volcanic ashes or gouges, which accommodate significant internal deformation by pressure solution grain boundary sliding with mostly aseismic sliding.
3.4 Conclusion on the observation of natural pressure solution
If one considers the strength versus depth diagram − the famous “Christmas tree” − it is necessary to add a third mechanism corresponding to pressure solution creep (Fig. 4f), which may develop at low differential stress at geological rate (10−10 − 10−15 s−1) (Bos and Spiers, 2002; Gratier and Gamond, 1990). This pressure solution process can develop in different ways depending on the nature and the structure of the rocks: pressure solution grain boundary sliding (Fig. 3) or fracture assisted pressure solution (Fig. 2). It can accommodate either all the deformation or only part of it in association with earthquakes (Fig. 4), through the upper and middle crust (Verberne et al., 2020). It can be associated with metamorphic processes as dissolution precipitation mechanisms (Malvoisin and Baumgartner, 2021; Ruiz-Agudo et al., 2014; Wintsch and Keewook, 2002). This depends mainly on the solubility and sizes of the grains and on the nature of their contacts. To best understand this difference in behavior and how it evolves over time, it is necessary to consider the experimental results presented in the next part along with some basic concepts of pressure solution.
4 Experimental pressure solution in the laboratory
4.1 Basic concepts of pressure solution
Pressure solution is a stress-driven process that links chemical and mechanical forces, as first suggested many years ago by (Sorby, 1863; Thomson, 1861). This behavior has been theorized through the thermodynamics of phase equilibrium (Gibbs, 1877) with a first analytical solution proposed by (Weyl, 1959) for the dissolution and diffusion of solute along stressed grain contacts. To discuss this thermodynamic aspect, one can consider an indenter with vertical compression on a piece of soluble mineral in the presence of its solution (Fig. 5a). Assuming non-hydrostatic thermodynamics, mass transfer is induced by the difference in chemical potential linked to the difference in normal stresses between the vertical compressive stress and the fluid pressure in the zone of re-deposition (Paterson, 1973). In detail, stress distribution must vary radially along the dissolving surface in order to maintain a steady-state displacement, and this must be integrated into the normal-forces-to-the-interface equilibrium (Rutter, 1976). In the framework of non-equilibrium thermodynamics, (Lehner and Bataille, 1985) generalized Gibbs’ condition of equilibrium between a solid under stress and a fluid by considering the limiting state of zero entropy production. In addition to the effect of the normal stress, the difference of chemical potential driving pressure solution may also include contributions due to elastic strain, plastic strain and interfacial tension energy, Figure 5a (Heidug and Leroy, 1994; Shimizu, 1992).
 (1)
(1)
where Δμ is the difference in chemical potential, σn is the mean normal stress on the dissolving surface, Pf is the free fluid pressure in the zone of re-deposition, Vs is the molar volume of the solid in solution, ΔEe, ΔEp, ΔEs are the difference in elastic strain, plastic strain or surface tension energies between dissolution and re-deposition zones respectively: ΔEe the elastic energy, is associated with the elastic deformation of the solid object (Poirier, 1985), ΔEp the energy of dislocation, can be divided into two terms: the energy of the core of the dislocations itself, and the strain energy due to the deformation of the crystalline lattice (Wintsch and Dunning, 1985), and ΔEs the surface energy, is proportional to the surface energy γ and inversely proportional to the principal radii of curvature of the surface r (Kingery et al., 1976). The contributions of all the terms are not equivalent. The difference in normal stresses is usually the main driving force of mass transfer. For example, for stressed quartz grains of 100 µm radius, at 400∘C, 300 MPa, with a concentration of dislocations of 109 cm−2, the work related to the change in volume under normal surface stress (first term of Eq. (1)) makes the largest contribution to the chemical potential of the solid adjacent to the surface (6800 Jmol−1), whereas the other three energy terms contribute to 13, 3 and 0.4 Jmol−1 respectively. The surface energy effect becomes important for the small length scales like for extremely fine grains or for the organization of the grain boundary (Gratier et al., 2013a). It must be noted that pressure solution may occur in open systems in some cases, and be associated with fluid flow with diffusion-infiltration coupling (Lehner, 1995).
A discussion of pressure solution must also mention the force of crystallization (Correns, 1949; Taber, 1916; Weyl, 1959): if the fluid solute activity in the free fluid corresponding to a pressure Pf is higher than the solute activity of the solid corresponding to the normal stress σn, a force of crystallization is induced at the re-deposition contact (Fig. 5b) with an overpressure ΔP that is proportional to the ratio of the solute activities. ΔP is in fact the maximum crystallization pressure that can develop due to the activity difference if all of the thermodynamic driving force appears at the growing interface (Kelemen and Hirth, 2012; Steiger, 2005; Wolterbeek et al., 2018):
 (2)
(2)
where R (8.31 J mol−1 K−1) is the gas constant, T (°K) is the temperature, af and ac are the fluid and solid activity at Pf and σn respectively (Noiriel et al., 2010). For example, the force of crystallization of halite is well known to be capable of damaging some monuments (Espinosa-Marzal and Scherer, 2010). An example of natural force of crystallization is discussed in the section devoted to pressure solution modeling, §5-3, (Gratier et al., 2012).
In addition to the thermodynamics aspect, there is a kinetics aspect. There are three successive steps in the pressure solution process: (1) dissolution, (2) transfer by diffusion, and (3) re-deposition (Raj and Chyung, 1981; Rutter, 1976; Weyl, 1959). If any of these in-series processes is much slower than the others it will control the kinetics of the whole process.
- If the diffusion rate is the limiting process, the displacement rate will be proportional to the coefficient of diffusion (D), the mean width of the path of mass transfer below the indenter (w), the solubility of the solid in solution (c), and the difference in normal stress between dissolution and re-deposition stress Δσn, with in some conditions a non-linear relation (Dewers and Ortoleva, 1990; Spiers and Brzesowsky, 1993) that will be discussed later and is inversely proportional to the square of the distance of mass transfer (d) along the trapped fluid phase.
 (3)
(3)
- If the dissolution or crystallization rate is the limiting processes, the displacement rate of a cylindrical indenter will be proportional to the interface kinetics (k), the solubility of the solid in solution (c), and the driving stress Δσn with also a non-linear relation in some conditions (Gratier et al., 2013a).
 (4)
(4)
To differentiate these deformation laws, it must first be noted that the effect of solubility is the same, so it is theoretically possible to activate creep by increasing the solubility of the solid in solution without changing the type of law. Next, the activation energy differs widely between diffusion and kinetics: 15 kJ/mole to 90 kJ/mole respectively (Fischer and Elliott, 1974), and in terms of dependence on the effect of crystal orientation on the dissolution and diffusion properties (Gratier et al., 2009; van Noort et al., 2007). Lastly, there is a clear difference in the effect of the mass transfer distance (Lehner, 1995; Renard et al., 2000).
The last issue concerns the structure of the fluid phase. Dissolution is promoted at the level of a fluid phase trapped under stress that must allow molecular diffusion as in a liquid. There are four types of model (Fig. 5c) for such a structure (Gratier et al., 2013a). The oldest model is a smooth continuous thin film that is trapped under stress (Weyl, 1959). Later, a more complex discontinuous model of an island-channel structure was proposed (Raj and Chyung, 1981) in which dissolution and diffusion occur along a free fluid in channels. Subsequently, (Lehner and Bataille, 1985) suggested a dynamic roughness for the stressed contact that could evolve over time. A fourth model, the dynamic island-channel model, explicitly extended this idea of dynamic evolution over time to the whole geometry of the island and channel structure (Dysthe et al., 2003; Ghoussoub and Leroy, 2001).
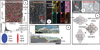 |
Fig. 3 Pressure solution markers in similar folds: (a) cross section through the Western Alps; (b) slaty and spaced cleavages (left) and tectonic segregation by pressure solution around a rigid object (right); (c) spaced cleavage and tectonic layering; (d) large deformation (red ellipse) by grain boundary sliding of near equant very fine grains (grain size diagram and blue ellipse); (e) schematic evolution of pressure grain boundary sliding by dissolution (gray) and redeposition (white), (Gratier et al. 2023). Marqueurs de pression solution dans des plis semblables : (a) coupe transversale dans les Alpes occidentales ; (b) schistosité espacée et de flux (gauche) et ségrégation tectonique par pression solution autour d’un objet rigide (à droite) ; (c) schistosité espacée et litage tectonique ; (d) grande déformation (ellipse rouge) par glissement aux joints de grains très fins presque équants (ellipse bleue et diagramme de tailles) ; (e) évolution schématique du glissement aux joints de grains par pression solution avec dissolution (gris) et redéposition (blanc), (Gratier et al. 2023). |
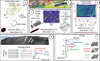 |
Fig. 4 Pressure solution markers in shear zones: (a) map view of the North Anatolian Fault with seismic and aseismic sliding; (b) pressure solution creep with stylolites, fractures and sealing in seismic zones; (c) pressure solution grain boundary sliding within kilometric width damage zones and (d) within metric width gouges; (e) view of damage zones and gouges in quarry, (Kaduri et al. 2019). (f) Rocks strength versus depth diagram including the three main mechanisms of deformation in the upper crust (Gratier & Gamond 1990). Marqueurs de pression solution dans les zones de cisaillement : (a) carte de la faille nord-anatolienne avec glissement sismique et asismique ; (b) fluage par pression solution avec stylolites, fractures et colmatage dans des zones sismiques (c) fluage par pression solution par glissement aux joints de grains dans des zones d’endommagement de largeur kilométrique et (d) dans les gouges métriques ; (e) zones d’endommagement et gouges dans une carrière, (Kaduri et al. 2019). (f) Résistance des roches en fonction de la profondeur avec les trois principaux mécanismes de déformation de la croûte supérieure (Gratier et Gamond 1990). |
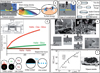 |
Figure 5 Pressure solution basic concepts and indenter experiments: (a) driving forces of pressure solution; (b) force of crystallization; (c) various models of trapped fluid phases under stress (Gratier et al. 2013a). (d) Indenter experiments showing the difference between like or unlike contacts (Hickman and Evans 1995). (e) Experimental microstylolites (top) and their development rooted on dislocations (bottom), (Gratier et al. 2005). (f) Self-affine scaling invariance of natural stylolites with Hurst exponents from 0.5 to 1.2 with cross over value (Lc) characteristic of the stress magnitude during the stylolites growth (Schmittbuhl et al. 2004). Concepts de base de la pression solution et expériences d’indentation : (a) forces motrices de la pression solution ; (b) force de cristallisation ; (c) divers modèles de phases fluides piégées sous contrainte (Gratier et al. 2013a). (d) Expériences d’indentation montrant la différence entre des contacts similaires ou différents (Hickman et Evans 1995). (e) Microstylolites expérimentaux (en haut) et leur développement enraciné sur des dislocations (en bas), (Gratier et al. 2005). (f) Invariance d’échelle auto-affine des stylolites naturels avec des exposants de Hurst de 0,5 à 1,2 avec une valeur de croisement (Lc) caractéristique de l’ampleur de la contrainte pendant la croissance des stylolites (Schmittbuhl et al. 2004). |
4.2 Effect of the nature of the crystals at the stressed contact
The nature of the contact was tested through an indenter experiment under a microscope, Figure 5d, (Hickman and Evans, 1995). This showed that dissolution rates between two types of solid, such as halite and silica, are much slower in the case of halite-halite (soluble/soluble, like contact) than in the case of halite-silica (soluble/insoluble, unlike contact). The difference (Fig. 5d) could be linked to the structure of the fluid phase trapped under stress, which is less continuous in case of like contacts because grain boundaries can become sealed together better in like contacts than in unlike contacts (Schutjens and Spiers, 1999; Van Oosterhout et al., 2022). This experiment, like others (van Noort et al., 2007; Zubtsov et al., 2004) and like the observations of natural deformation (Figs. 2–4), shows that pressure solution creep is more efficient on polymineralic rocks than on monomineralic ones. (Hickman and Evans, 1995) also showed that the presence of some clay minerals trapped in the halite-silica contacts drastically accelerates the indenting rate (Fig. 5d). The presence of phyllosilicates accelerating the pressure solution rate is also observed in nature (Heald, 1955; Renard et al., 1997) as phyllosilicates trapped in the stressed contact increase the diffusion rate or it could be a more complex coupled thermodynamic and kinetic effect (Meyer et al., 2006). This is discussed in more details in (Gratier et al., 2013a).
In the relatively short experiments of (Hickman and Evans, 1995), no displacement is observed with like contacts. However, in much longer experiments, such as those in hydrothermal conditions on quartz aggregate deformed experimentally at 350°C over several months with a high solubility solution for quartz (NaOH 0.1 M), (Gratier et al., 2005), small indenting displacements are indicated by microstylolites at like contacts very similar in appearance to those in nature except that they are very tiny, measuring a few microns in size (Fig. 5e), see also (Schutjens et al., 2021). The stylolite peaks are rooted on the dislocations in the quartz; these dislocations initiate and amplify the interface dissolution. However, this amplification is limited by two counter-effects: the surface energy and the elastic strain energy, which tend to reduce the roughness of the stylolites and stabilize their development. These microstylolites, like the natural stylolites, may be described by a self-affine scaling invariance with Hurst exponents varying between 0.5 and 1.2 with a characteristic crossover value that depends on the surface and elastic strain energies, Figure 5f, (Schmittbuhl et al., 2004). This provides a means of evaluating the depth of stylolite development in nature (Ebner et al., 2009; Rolland et al., 2012).
4.3 Pressure solution creep law from indenter experiments
The pressure solution creep law may be established from indenting experiments on quartz with a metal indenter in hydrothermal conditions: T = 350−360°C, Pf = 20-120 MPa, Δσn = 25-350 MPa, fluid such as NaOH 0.1 M, over long periods (several months) and using two diameters for the indenters (200 microns and 1 mm) (Gratier et al., 2009). The depth of the indented hole was measured at the end of the experiments. Only the indenters with the smaller diameter produced measurable indenting. In Figure 6a various displacement rates are plotted versus stress in a semi-log plot for different conditions. The differences lie in the nature of the quartz (natural or synthetic), the orientation of the stressed crystal contacts (prismatic or basal face) and the way the cell is filled either before or after applying the stress on the indenter. First, the driving force is clearly the difference between the normal stress and the fluid pressure with an exponential stress effect, but this effect become negligible when the stress is lower than a few tens of MPa. The limiting process is diffusion, as there is no effect (i) from the crystal orientations (either with basal or prismatic faces at the contacts), or (ii) from the type of quartz, (either synthetic or natural), whereas the size of the indenter has a drastic effect (no indentation with 1 mm diameter). Lastly, the interface structure is of the dynamic island-channel type, since there must have been some exchanges between the stressed interface and the free fluid, as indicated by the fact that fluid can fill the interface even when it is under stress. This is confirmed by the widely varying contact roughness, and explains the large data dispersion given that the deformation is highly sensitive to the microstructure of the contacts. This was observed in other indenter experiments, always with large dispersion in the stress versus displacement rate relations (Croize et al., 2010).
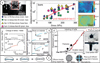 |
Figure 6 Pressure solution indenter experiments: (a) data for pressure solution creep law from indenter experiments (center) in various conditions (left) and various roughness of the dissolution surfaces (right) (Gratier et al. 2009). (b) Indenter experiments with change of stress (Dysthe et al, 2002, Gratier et al. 2014). (c) Schematic evolution of the fluid phases trapped under stress over time. (d) Accelerating effect of the fracturing on pressure solution indenting experiment (Gratier 1993) and predicted slow fracture healing (dashed red line). Expériences de pression solution par indentation : (a) données pour une loi de fluage par pression solution issue d’expériences d’indentation (centre) dans diverses conditions (gauche) et diverses rugosités des surfaces de dissolution (droite) (Gratier et al. 2009). (b) Expériences d’indentation avec changement de contrainte (Dysthe et al. 2002, Gratier et al. 2014). (c) Evolution schématique des phases fluides piégées sous contrainte au cours du temps. (d) Effet accélérateur de fracturation dans une expérience d’indentation par pression solution (Gratier 1993) et cicatrisation lente prédite de la fracture (pointillés rouges). |
4.4 Evolution of pressure solution rate related to change in stress
A number of indenting experiments have been performed that shows evolution of the displacement rate with a change of stress, either static (Fig. 6b-left) or dynamic (shock on the indenter, Fig. 6b-right) (Dysthe et al., 2002; Gratier et al., 2014). In all these cases a non-linear evolution in displacement over time is observed, in the form of a power law, which subsequently becomes linear. The effect of stress on variations in the stressed contact is still being debated. A change in stress may be seen to induce a change in the geometry of the stressed interface, making it rougher (Schutjens and Spiers, 1999) due to internal dissolution within the contact (for example rooted on dislocations as seen in Figure 5e (Gratier et al., 2005)). Two general observations can be made: firstly, an increase in stress can lead to a decrease in the thickness of the contacts by plastic deformation of the island contacts leading to a drastic reduction in the diffusive transfer and reaction rate properties of the contact up to dissolution-controlled deformation (de Meer et al., 2005; van et al., 2009 van Noort and Spiers, 2009). However, an increase in stress may lead to an increase in the diffusive transfer properties in relation to the development of microcracks at the grain boundary scale (Croize et al., 2010; den Brok, 1998; Gratier et al., 2009; Gratier et al., 2014; Gratz, 1991). These microcracks act as diffusion shortcuts since they are filled with a free fluid at a diffusion rate that is much faster than in the mean trapped fluid phase. However, these microcracks filled with reactive solution always heal by minimization of the surface energy (Brantley et al., 1990; Smith and Evans, 1984) and develop into a cloud of fluid inclusions that is much less favorable to diffusion than in the case of a more continuous fluid phase. In all cases this explains the decrease in pressure solution rate over time, up to a linear evolution when the contact is stabilized. The development of either plastic or brittle deformation depends on the minerals and on the conditions of deformation.
4.5 Evolution of pressure solution rate in relation to fracturing and healing
The effect of fracturing can be seen at another scale (Fig. 6d), on an indenting experiment on halite (Gratier, 1993). A constant rate of displacement was recorded over 70 days, after which the rate suddenly increased and remained at the same fast rate for a similar duration. The explanation given is that, on the day the displacement rate change occurred, radial fractures developed within the halite crystal following a shock on the indenter. This fracturing effect is linked to the fact that indenting by pressure solution is controlled by diffusion. Before the fracturing, the mean distance of diffusive mass transfer under the indenter was the radius of the indenter. The fracturing induced a shortcut in the diffusion path, since the fluid in the fractures is free and diffusion is much faster within this fluid than along the mean fluid phase trapped under stress. Therefore, the new mean distance of mass transfer controlling the indenting rate was more than halved. This is typical of what happens in nature during the fracturing process. In nature, however, the fracture will progressively heal, or be sealed, and the accelerating effect of the fracturing will progressively disappear. The effect of fracturing on pressure solution is hence transient, lasting between a few years and thousands of years in natural deformation, depending on the rocks (Gratier et al., 2013a).
4.6 Evolution of the rate-limiting process with fluid composition change
Another experimental approach is to consider aggregates compacted with fluid infiltration. This was done by (Zhang and Spiers, 2005; Zhang et al., 2011), Figure 7a. They observed that with common fluids (pure or saline solutions), the rate-controlling process is diffusion. However, when ions such as phosphates or magnesium are added to the fluid that flows through the solution, the compaction rate is significantly reduced. This can be explained by the fact that these ions, which are well known to reduce the reaction rate, induce a shift in the controlling factor from diffusion to reaction rate. In natural deformation, therefore, aggregate compaction and deformation, which are usually controlled by diffusion (Gratier et al., 2013a), may be controlled by the reaction rate in some specific cases, such as with a chemical variation of the fluid composition, or when plastic deformation of grain boundary islands under stress could slow down pressure solution rates by several orders of magnitude and be associated with dissolution-controlled deformation (van Noort and Spiers, 2009).
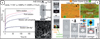 |
Figure 7 Pressure solution experiments on aggregates : (a) evolution of the rate limiting process with fluid flow composition change from pure or saline solutions (diffusion-controlled compaction) to solutions with phosphate or Mg2+ (reaction rate-controlled compaction) (Zhang et al. 2011). (b) Rock layering development in aggregate of plaster (gypsum, orange) and clay (green) with self-organized propagation of dissolution seams (red lines, bottom) from weakened zones rich in clays (center) and around strengthened zones rich in gypsum (right) (Gratier et al. 2015). Expériences de pression solution d’agrégats : (a) évolution du processus limitant avec le changement de composition du fluide en écoulement de solutions pure ou saline (compaction contrôlée par la diffusion) à des solutions avec du phosphate ou du Mg2+ ; (compaction contrôlée par la vitesse de réaction) (Zhang et al. 2011). (b) Développement de litage dans un agrégat de plâtre (gypse, orange) et d’argile (vert) avec propagation auto-organisée de joints de dissolution (lignes rouges, en bas) à partir de zones affaiblies riches en argiles (au centre) et autour de zones durcies riches en gypse (à droite) (Gratier et al. 2015). |
4.7 Experimental evidence for rock layering development by pressure solution
As seen in Figure 3c, natural deformation is commonly associated with development of diagenetic or tectonic layering, leading to irreversible structure transformations. Development of differentiated layering, similar to that observed in natural deformation, has been reproduced experimentally on plaster and diatomite (Gratier et al., 2015). For example, samples of gypsum plaster mixed with 10% clay (Fig. 7b top) saturated with aqueous solutions in equilibrium were subjected to loading for several months at 40°C. X-ray microtomography and scanning electron microscopy observations showed that layering develops through a self-organized pressure solution process. Stress-driven dissolution of the soluble minerals (gypsum) is initiated in the zones initially richer in insoluble species (clay), as diffusive mass transfer along the interface between soluble and insoluble minerals is much faster than along the healed boundaries of the soluble minerals. The passive concentration of the insoluble minerals amplifies the dissolution along layers oriented perpendicularly to the maximum compressive stress. Conversely, in zones with an initial low content of insoluble minerals and clustered soluble minerals, dissolution is slower. Consequently, these zones are less deformed; they host the re-deposition of the soluble species and act as rigid objects that concentrate both stress and dissolution near their boundaries, thus amplifying the differentiation and the development of layered microstructures in a self-organized pressure solution process (Fig. 7b bottom). The implication for the mechanical stability of underground storage and geo-energy facilities is that aggregates of very soluble minerals (gypsum and especially halite) mixed with various insoluble species (e.g., clays) may develop relatively quickly into layered structures with the development of weak surfaces, as the dissolution seams, which may evolve to slip surfaces and weaken the entire aggregate.
4.8 Conclusion of experimental approaches
Pressure solution may be described as a viscous process with creep laws that relate strain rate to various thermodynamic, chemical and geometric parameters. The limiting process is usually diffusion, but it could be reaction rates if such reaction rates are drastically reduced by chemical reactions or plastic deformation at the stressed interface. The dynamic channel-island structure of the stressed interface deduced from the experiments is associated with three crucial effects: (i) the fact that fluid can invade initially dry stressed interfaces, (ii) the effect of the nature of the contact: diffusive mass transfer is faster at unlike contacts than at like contacts, and (iii) the effect of microfracturing and healing processes: fracturing increases the pressure solution rate, whereas healing reduces it.
5 Modeling of pressure solution for various rocks
5.1 Superplastic deformation by grain boundary sliding
The first example is the modeling of large deformation with slaty cleavage, which can be found at all depths in the upper crust for polymineralic rocks with soluble and insoluble fine grains (Figs. 3 and 4). First, it is necessary to evaluate the type of creep law in order to identify the limiting process. On the example of alpine deformation of the Oisans massif (Fig. 3), the observation is clear when comparing (Fig. 8a) the deformation of shales and granitoids: very fine grain shales are extensively deformed, whereas large grain granitoids show no ductile deformation and only local brittle deformation associated with thrust faults (Bellanger et al., 2014; Dumont et al., 2008). This is significant because in these P-T conditions the pressure solution rates of calcite and quartz are almost the same (Fig. 3b). Therefore, this high sensitivity to grain size best agree with a model for diffusion controlled pressure solution. A model of superplasticity by grain boundary sliding is used, Figure 8b (Gratier et al., 2023):
 (5)
(5)
where  is the strain rate, A is a numerical coefficient depending on the geometry of the mass transfer path which is here equal to 14, c (mol. m−3) is the solubility of the diffusing solid into a thin grain boundary fluid phase, Vs (m3 mol−1) is the molar volume of the stressed solid, R (8.31 J mol−1 K−1) is the gas constant, T (°K) is the temperature, D (m2 s−1) is the diffusion constant along the trapped fluid phase at the stressed interface, w (m) is the mean thickness of the fluid interface along which diffusion occurs, σd (Pa) is the differential stress, below 30 MPa the effect of the exponential effect is negligible, and d (m) is the grain size. The value of Dw, which is the only unknown parameter, is deduced from two experiments on quartz and calcite as about 6 10−19 m3 s−1 at 350°C (Gratier et al., 2009; Zhang et al., 2010). This creep law can be used to draw deformation maps with lines of strain rate plotted in a stress versus grain size diagram for quartz and calcite at a 5 or 8 km depth. Calcite deformation is also drawn at a 2 km depth, but quartz deformation is not, because quartz pressure solution could be controlled by reaction rate at low temperatures (Renard et al., 1999).
The quartz experiment is indicated on the map and corresponds to a 10−9 s−1 strain rate (Gratier et al., 2009). The problem is that, taking the natural example the strain rate is known to be much lower, probably 10−14 s−1 (Gratier et al., 2023). With this deformation map (Fig. 8c), rocks with a grain size of 200 microns should allow deformation to occur, but this is not the case in the Oisans massif, where only very small grain sizes (1-3 microns) are associated with large ductile deformation (Fig. 8a-left). Therefore, at very low stress, there appears to be a difference of five magnitudes between the experiment and nature. How can this discrepancy be solved? The variation in the Dw parameter has already been discussed from experimental results (Fig. 6). It is assumed here that an increase in stress leads to microcracks development (as observed in experiments where the stress values for quartz, for example, are as high as 100-300 MPa), but that this effect disappears at low stress. Moreover, contact healing occurs in all cases but must be even more efficient at low stress (van Noort et al., 2008). Therefore, to be as simple as possible, a correcting factor was added to this Dw value to reduce it as stress decreases, thus retaining the experimental value of Dw at high stress (100 MPa) and reducing it at low stress by up to the required five magnitudes in a studied zone that can be named fold creep (Fig. 8d). This correction factor expresses the evolution of the effect of stress between the accelerating effect due to the development of micro-fractures always observed at high stress (notably in experiments) and the slowing effect due to the development of healing at low stress. In addition, (Spiers et al., 2004) pointed out that, in very fine materials, the diffusion path at grain scale can become so short that diffusion becomes faster than reaction, particularly in the presence of impurities in the fluid phase (Fig. 7). This would imply that a vertical line corresponding to very small grain size could separate two domains: diffusion-controlled (largest grains) and reaction-controlled (smallest grains) in the deformation maps. However, in the absence of data to fix such a transition, diffusion-controlled deformation map is consistent with the observations that, in the same deformation context, fine-grained rocks are much more deformed than large-grained rocks (Fig. 8a), attesting to the high sensitivity of the deformation to grain size and, consequently, for diffusion-controlled pressure solution over a wide spectrum of grain sizes. With this type of stress-dependent slowness coefficient, the exponent of stress in the pressure solution creep law is no longer 1 (below 30 MPa, see above) and could be higher, probably between 1 and 2 depending on the correction factor that must be calibrated. A stress exponent of 1.7 was found in grain boundary sliding experiments, for example, but at temperatures higher than those considered here (Schmid et al., 1977). This new deformation map fits both the experiments (corresponding also to present-day fault creep where the stress may be as high (Gratier et al., 2011)) and the deformation associated with folds and shear zones with cleavage at low stress (Figs. 3–4c). It must be noted that, if this deformation map is used to predict underground storage behavior, rocks with a grain size of a few microns such as shales can be expected to undergo extensive deformation under differential stress of several MPa at a relatively fast rate of about several tens of percent of shortening in about 1 yr.
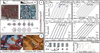 |
Figure 8 Superplastic deformation by pressure solution: (a) in parallel ductile (fine grains shale, Gratier et al. 2013) and brittle deformation (large grains granitoid, Bellanger et al. 2014), Alps; (b) pressure solution grain boundary sliding model for large deformation with mass transfer from the most to the less stressed areas; (c) deformation maps using Dw values from experiments; (d) deformation maps using Dw values with a slowness coefficient leading to a decrease of Dw values as stress decreases (Gratier et al., 2023). (e) Pressure solution creep model by stylolites and fractures in granitoids and limestones (Gratier et al. 2003, Kaduri et al. 2019), (f) with this model: stress evolution with time at constant strain rate (Gratier et al. 1999b). Déformation superplastique par pression solution : (a) déformation ductile (schiste, grains fins, Gratier et al. 2023) en parallèle avec une déformation fragile (granitoïde, gros grains, Bellanger et al. 2014), Alpes ; (b) modèle de glissement aux joints de grains par pression solution pour grandes déformations avec transfert de matières des zones les plus contraintes vers les zones les moins contraintes ; (c) cartes de déformation utilisant les valeurs Dw des expériences ; (d) cartes de déformation utilisant les valeurs Dw avec un coefficient de lenteur entrainant une diminution de Dw avec la diminution des contraintes, (Gratier et al. 2023). (e) Modèle de fluage par pression solution avec stylolites et fractures dans granitoïdes ou calcaires (Gratier et al. 2003, Kaduri et al. 2019), (f) avec ce modèle: évolution de la contrainte avec le temps à vitesse de déformation constante (Gratier et al. 1999b). |
5.2 Long-term near-stable pressure solution deformations associated with fracturing
One can now consider what happens in zones that do not deform easily due to large grain sizes, as in the case of rocks deformed with stylolites and fractures in the limestone of the North Anatolian fault in Turkey and in the granitoid of the San Gabriel fault in California (Fig. 8e).
Deformation maps (Fig. 8d) show that, with a grain size of 1 to 2 mm, pressure solution creep is only possible at relatively high stress. This high stress induces the fracturing that is seen associated with stylolites (Fig. 8e). As seen in experiments (Fig. 6), this fracturing increases the deformation rate but is only a transient effect since it is counteracted by the healing of the fractures. It is possible to develop a simple model of the indenting of two fractured grains or pebbles (Fig. 8f) at a constant pressure solution indenting rate (Gratier et al., 1999b). The progressive deformation is associated with an increase in the dissolution surface. Taking into account the stress versus diameter of dissolution ratio (Δσn/d2), and without any fracture, the stress value must increase during progressive deformation in order to keep the displacement rate constant (stage 1 to 2, Fig. 8f). However, the stress value cannot increase indefinitely since the grains, or pebbles, will necessarily fracture. When the stress value reaches the fracture strength of the grains or pebbles (stage 3, Fig. 8f), fracturing occurs with partition of the dissolution surface into several smaller parts. According to the experimental indenter results (Fig. 6d), this fracturing process develops fast diffusive mass transfer paths by reducing the mean distance of this transfer (d) along the dissolution surface. Consequently, the stress value needed to maintain a constant displacement rate is reduced. A near-stable viscous process is predicted, activated in a transient manner by fracture development. The non-linear stress versus time relation (Fig. 8f) is linked to the stress versus a water film thickness which is non-linear below a yield stress and linear above it (Renard and Ortoleva, 1997). The evolution of recovery over time is linked to the increase of the contact surface. The fracture sealing is not taken into account in this simple model but it also increases the contact surface and it could be included in a creep process coupling stylolites and fractures (see §6). In any case, this shows how pressure solution coupled with fracturing can accommodate a near-stable viscous deformation process in the ductile deformation of flexural folds and shear zones (Figs. 2–4b).
5.3 Pressure solution associated with earthquakes: post-seismic creep and sealing by pressure solution processes
If pressure solution creep rate cannot accommodate the tectonic loading rate imposed on the crust by the plate dynamics (Fig. 1a), then earthquakes occur in the upper and middle crust (Fig. 4f). In the post-seismic period, pressure solution plays two crucial roles that are linked: fault creep (Fig. 9d) and fault healing (Fig. 9a-b). Post-seismic and interseismic fault creep may be modeled either by rate-and-state-dependent friction (Scholtz, 1998) or by considering rocks deformation as controlled by a competition between rate-sensitive (pressure solution creep) and rate-insensitive (frictional sliding) interactions between grains (Chen et al., 2022; Verberne et al., 2020) or by pressure solution grain boundary sliding as a large strain mechanism of superplastic flow (Gratier et al., 2023) or by pressure solution coupled with fractures (Gratier et al., 1999b) depending on the composition and microstructure of the rocks. In parallel, laboratory and field observations highlight the important role played by the post-seismic recovery of strength through the healing of faults and show that pressure solution is a key mechanism in this healing process (Gratier, 2011; Hunfeld et al., 2020; Tenthorey and Cox, 2006; Yasuhara et al., 2005).
In nature, several pressure solution processes may develop during fault zone sealing. The first one is self-healing of the fractures by minimization of the surface energy: the fracture interfaces develop into clouds of fluid inclusions (Smith and Evans, 1984). This is relatively fast but only concerns the healing of microcracks, because the surface energy is strongly dependent on the curvature of the surfaces (Kingery et al., 1976). Sealing of the largest fractures by pressure solution may then occur by fluid infiltration with dissolution at depth at free fluid contacts or along some cleavage planes. This process may be relatively fast, but is always limited by the closure of the fluid flow paths (Fig. 9a-center). Associated with fluid flow, force of crystallization may develop in nature as shown by near-horizontal calcite veins growing in red sandstones in Utah (USA), in conjunction with travertine development, Figure 9c (Gratier et al., 2012). Dating the calcite of the veins using the U/Th technique shows that the older growth increment is at the top of the decimeter-thick veins and the more recent one is at the bottom of the veins. This travertine vein growth from top to bottom lifts the rocks above them under the effect of the crystallization force. This can be explained by the presence of a fluid flow with dissolved CO2 coming from depth. When the fluid reaches a critical pressure the CO2 can degas, inducing precipitation of calcite at the contact with the rocks with a force of crystallization that uplifts the overlying rocks (Eq. (2)). It is possible to estimate both the force of crystallization that is high enough to uplift 10–20 m of sandstones and the growth rate of these veins, which is about 0.3 mm/yr.
Lastly, sealing can also be associated with dissolution in stylolites and re-deposition in veins. In this case the sealing is associated with a change in the distance of mass transfer along the fluid phase trapped under stress, and is hence strongly non-linear (Fig. 9a-right) (Renard et al., 2000). This leads to an exponential decrease in the porosity and permeability of the rocks that may be simplified as an exponential with the negative ratio of time over the characteristic time of sealing rate, which is representative of the rocks (Fig. 9b-left). It is possible to model the evolution of fluid pressure assuming a model of the distribution of the calcite and quartz mineral characteristics for the fracture sealing rate (Gratier et al., 2003). The fluid pressure may reach the lithostatic pressure after a few centuries (Fig. 9b-right). Strengthening due to fault healing and the increase in fluid pressure facilitate new earthquakes, leading to successive seismic episodes. Successive earthquake cycles over years to millennia could lead to mass transfer input towards the damage zones or mass transfer output from the gouges that could lead to large transformations of the rocks over time: in most cases, strengthening of the damage zones and weakening of the gouges by tectonic differentiation (Figs. 3–7b) (Gratier and Gamond, 1990; Wintsch et al., 1995).
Consequently, after each earthquake the post-seismic creep is strongly non-linear. The fault zone may be modeled as a ductile material undergoing pressure solution creep and sealing processes. It is assumed that after an earthquake a weakening process occurs due to the general fracturing of the fault, since fracturing is shown to accelerate the pressure solution process, and then a strengthening process develops over time due to the healing of the fault, which is shown to reduce the pressure solution rate (Gratier and Gueydan, 2007). Consequently, at a constant shear strain rate, the effective shear stress of the fault is expected to decrease after the earthquake and then progressively increase up to its value at the time of the earthquake. This duration could qualify an earthquake cycle. The duration of such a cycle depends on the rates of weakening and strengthening. As seen in Figure 9d a difference in sealing rate, and hence in the strengthening rate, leads to a difference in the time taken to recover from the earthquake and hence in the earthquake cycle duration (Chen et al., 2021; Gratier and Gueydan, 2007). Any human-induced transformation such as an input or output of fluid, mass transfer, deposition or dissolution at depth could induce earthquakes (Foulger et al., 2018) and modify their cycles. When investigating evolutions of the exponent of the power law that may characterize the evolution of displacement over time after fracturing (from 0.3 to 1, Fig. 6b), this exponent has been found to vary also in nature for example from 0.25 to 0.4 for the post-seismic displacement after the Parkfield earthquake along the San Andreas fault (Gratier et al., 2014). By measuring this evolution over time it could be possible to ascertain the moment when healing of the fault is almost complete and this exponent reaches 1 (Fig. 6b) and, hence, the significant increase of probability of a new earthquake.
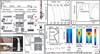 |
Figure 9 Post seismic pressure solution creep and sealing: (a) various types of fracture sealing (Gratier and Gueydan 2007) from fast self-healing to sealing associated with fluid flow up to slow diffusion-controlled fractures sealing with exponential decrease of porosity and permeability (Renard et al. 2000). (b) Calculation of fluid pressure evolution from hydrostatic to lithostatic values (Gratier et al. 2003) depending on the minerals. (c) Natural example of the force of crystallization in veins with top to bottom growth that uplift the 10-20m of rocks above (Gratier et al. 2012). (d) Evolution of the duration of the seismic cycles depending on the rate of fault healing and strengthening (Gratier and Gueydan 2007). Fluage et colmatage post sismique par pression solution: (a) différents types de colmatage (Gratier et Gueydan 2007) de l’auto-cicatrisation rapide au colmatage associé à des écoulements de fluides jusqu’au lent colmatage des fractures contrôlé par diffusion avec diminution exponentielle de la porosité et de la perméabilité (Renard et al. 2000). (b) Calcul de l’évolution de pression des fluides de valeurs hydrostatiques à lithostatique en fonction des minéraux (Gratier et al. 2003). (c) Exemple naturel de force de cristallisation dans des veines avec croissance de haut en bas qui soulève les 10-20m de roches au-dessus (Gratier et al. 2012). (d) Evolution de la durée des cycles sismiques en fonction du taux de cicatrisation et du durcissement des failles (Gratier et Gueydan 2007). |
6. Conclusion: how to integrate rock deformation by pressure solution in behavior studies of underground storage and geo-energy facilities
Pressure solution is the main mechanism of creep and fault healing in the deformation of the upper crust (§2-3). This conclusion aims briefly to summarize ways in which rock deformation by pressure solution can be integrated into predictions of the long-term behavior of underground and geo-energy facilities (Fig.10).
First, it is necessary to recognize the possible occurrence of pressure solution processes. In the upper crust pressure solution can occur within any rocks that contain minerals such as calcite, dolomite, quartz, feldspar, serpentine, halite or gypsum, which are significantly soluble under stress in the natural fluids within the upper crust. In such rocks, earthquakes only occur if the pressure solution creep rate cannot accommodate the tectonic or human-induced stress loading rate, and in any given region it is always possible to find aseismic creep in some rocks and earthquakes in others depending on their compositions and microstructures (§3).
Various pressure solution creep laws can be used depending on thermodynamic and kinetic conditions (§4-1). The difference in normal stresses between dissolution and re-deposition zones is usually the main driving force (§4). Moreover, the pressure solution kinetics is usually controlled by the diffusive mass transfer rate from the dissolution to the crystallization reaction zones (§4-3), although reaction rates may be the controlling factors in some specific conditions when they are drastically reduced (§4-6). The distances of diffusive mass transfer vary from micron grain size to centimeter-sized fractured blocks (§3) depending on mineral grain solubility, grain size and type of grain contacts (like or unlike). Pressure solution is strongly dependent on the structure of the trapped fluid in the stressed contact and on the development of fractures and microfractures (§4.2, 4-4, 4-5). A dynamic island-channel model of stressed contacts shows clearly that fluid can penetrate into the contact even under stress. It also explains the large dispersion of stress versus strain rate relations that is seen in experiments (§4-3) and that must always be taken into account in pressure solution modeling.
The type of modeling (§5) required in order to predict the variation in deformation linked to any storage, injection or extraction of solid, fluid or gas can be evaluated from observations of the potentially deformable rocks. Beyond identifying the pressure solution markers (§3), the best way to identify the mobile species is to find some zones in the rocks that have been heterogeneously deformed and to compare zones that have been protected from deformation with zones that have been subjected to the maximum deformation. The potential of the pressure solution processes can thus be quantified in a given context (Figs. 2c and 3b). As regards the behavior of deformed rocks by pressure solution creep, two extreme cases are discussed here: deformation accommodated by pressure solution grain boundary sliding and by coupling of pressure solution and fracturing.
Pressure solution grain boundary sliding (§5-1) develops significantly in fine grain polymineralic rocks such as marls, shales, schists, volcanic ashes, serpentines and fault gouges, because diffusive mass transfers are more efficient in unlike contacts that in like contacts and because strain rate is inversely proportional to the cube of the distance of mass transfer (grain size) in diffusion-controlled deformation (Eq. (5)). This is observed in similar folds or in shear zones along creeping faults, with large strain values up to 100-300% of extension or more (Figs. 3 and 4) associated with slaty cleavage and self-organized layering development (Fig. 10a). Pressure solution grain boundary sliding is very efficient even with very low differential stresses and without any fractures, and evolves steadily over time. It corresponds to the red curve in the strength-versus-depth diagram (Fig. 10f). In the context of human-induced deformation, the rate of deformation of aggregate with a grain size of a few microns may be relatively high: up to several tens of percent of deformation over 1 yr with differential stresses of a few MPa (§5-1). Moreover in this context, the development of stress-induced layering may weaken aggregates of very soluble minerals (halite, gypsum, etc.) mixed with insoluble species through the relatively fast development of easy-sliding surfaces (Fig. 7b).
Alternatively, pressure solution coupled with fracture networks (§5-2) develops in monomineralic rocks such as limestones, sandstones or dolostones because diffusive mass transfer is less efficient in like contacts than in unlike contacts or in large-grain polymineralic rocks such as gneisses or granitoids, due to the grain size effect when pressure solution is diffusion-controlled. This mechanism is identified by observing spaced dissolution features such as stylolites or spaced cleavage cut by fractures, which are usually filled by the mineral transferred under stress (and hence usually called veins). Movement of micro blocks (mm to cm in size) bounded by stylolites and fractures accommodates all the types of deformation including flattening, shearing and rotation (Fig. 10b-c). This mechanism is found in flexural folds or in creeping fault zones affecting the rocks described above. It corresponds to the pink curve in the strength-versus-depth diagram (Fig. 10f). In the context of human-induced deformation, the deformation rate may be modeled by a near-stable behavior of coupled stylolites and fracturing (Fig. 10b-c), possibly using the deformation maps (Fig. 8d), but in this case using spacing between the fractures instead of grain size and including the fracture healing effect. Dating the re-deposited minerals (Fig. 9c) can help in evaluating the duration of deformation, which is a key parameter in the creep laws deduced from nature.
For the same type of rocks, in cases when this rate-sensitive near-stable pressure solution with fracturing creep cannot accommodate the stress loading rate, earthquakes occur (§5-3) with a non-linear evolution of post-seismic displacement, strength and fluid flows over time (Fig. 10d) that are controlled by pressure solution sealing and creep processes corresponding to the pink curves in the strength-versus-depth diagram (Fig. 10f). The process is reproduced by earthquake cycles ranging from years to millennia depending on the composition and microstructure of the rocks. The evolution of fluid flow and fluid pressure may be modeled by assuming an exponential decrease in porosity and permeability over time. The evolution of fault zone strength may be evaluated from the evolution of the exponent of the power law characterizing the evolution of displacement over time (§5-3).
If a high fluid pressure can develop locally with fluid flow (Fig. 10e), a force of crystallization is induced at the crystallization contact (Eq. (2)) that can force veins to open against the main compressive stress and uplift or destabilize some parts of the massif (§5-3). Well described in nature (Fig. 9c), this possible effect of the force of crystallization must always be checked when investigating the behavior of underground storage and geo-energy facilities.
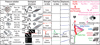 |
Figure 10 Summary of markers and models of pressure solution creep and sealing in the upper crust: (a) superplastic creep by grain boundary sliding ; (b) creep by the coupling of stylolites and fractures ; (c) creep by the coupling of grains - pebbles indenting and fracturing. (d) Post seismic pressure solution fault sealing and long term input and output of fluids in seismic fault zones. (e) Force of crystallization that uplifts the rocks above. (f) Rocks strength versus depth diagram for the three main mechanisms of deformation of the upper crust with various evolutions for pressure solution creep (bottom) depending on the composition and the structure of the rocks (top). Résumé des marqueurs et des modèles de fluage et de colmatage par pression solution dans la croûte supérieure : (a) fluage superplastique par glissement aux joints de grains ; (b) fluage par le couplage de stylolites et fractures ; (c) fluage par le couplage d’indentation de grains - galets et fracturation. (d) Colmatage post sismique des failles par pression solution et entrée et sortie de fluides à long terme dans les zones de failles sismiques. (e) Force de cristallisation qui soulève les roches au-dessus. (f) Diagramme de résistance des roches en fonction de la profondeur pour les trois principaux mécanismes de déformation de la croûte supérieure avec diverses évolutions pour le fluage par pression solution (bas) en fonction de la composition et de la structure des roches (haut). |
Acknowledgements
I thank the organizers of the “underground storage and geoenergies“ conference in memory of Pierre Bérest: A. Dimanov, A. Constantinescu, J. Sulem, P. Cosenza, L. Blanco-Martin, B. Brouard, P. Drobinski for inviting me to speak at this conference, C.J. Spiers for his thoughtful review and all my co-authors of the cited papers.
References
- Andreani M, Boullier AM, Gratier JP. 2005. Development of schistosity by dissolution-crystallization in a Californian serpentinite gouge. J Struct Geol 27: 2256–2267. [CrossRef] [Google Scholar]
- Ashby MF, Verrall RA. 1973. Diffusion-accommodated flow and superplasticity. Acta Metall 21: 149–163. [CrossRef] [Google Scholar]
- Bellanger M, Bellahsen N, Jolivet L, Baudin T, Augier R, Boutoux A. 2014. Basement shear zones development and shortening kinematics in the Ecrins Massif, Western Alps. Tectonics 33: 84–111. [CrossRef] [Google Scholar]
- Berest P, Blum P, Charpentier JP, Gharbi H, Vales F. 2005. Very slow creep tests on rock samples. Int J Rock Mech Min Sci 42: 569–576. [CrossRef] [Google Scholar]
- Berest P, Gharbi H, Bianco-Martin L, et al. 2023. Salt creep: transition between the low and high stress domains. Rock Mech Rock Eng. 56: 8305–8316. [CrossRef] [Google Scholar]
- Bos B, Spiers CJ. 2002. Frictional-viscous flow of phyllosilicate-bearing fault rock: microphysical model and implications for crustal strength profiles. J Geophys Res Solid Earth 107. [Google Scholar]
- Brantley S, Evans B, Hickman SH, Crerar DA. 1990. Healing of microcracks in quartz: implications for fluid flow. Geology 18: 136–139. [CrossRef] [Google Scholar]
- Burkhard M. 1992. Calcite twins, their geometry, appearance and significance as stress-strain markers and indicators of tectonic regime: a review. J Struct Geol 15: 351–368. [Google Scholar]
- Byerlee JD. 1978. Friction of rocks. Pure Appl Geophys 116: 615–626. [CrossRef] [Google Scholar]
- Cakir Z, de Chabalier JB, Armijo R, Meyer B, Barka A, Peltzer G. 2003. Coseismic and early post-seismic slip associated with 1999 Izmit earthquake (Turkey) from SAR interferomery and tectonic field observations. Geophys J Int 155: 93–110. [CrossRef] [Google Scholar]
- Chen CH, Niemeijer A, Spiers CJ. 2022. Seismic fault slip behavior predicted from internal microphysical processes. J Geophys Res Solid Earth 127: e2022J B024530. [Google Scholar]
- Chen J, Niemeijer AR, Spiers CJ. 2021. Microphysical modeling of carbonate fault friction at slip rates spanning the full seismic cycle. J Geophys Res: Solid Earth 126: e2020JB021024. [CrossRef] [Google Scholar]
- Chen J, Spiers CJ. 2016. Rate and state frictional and healing behavior of carbonate fault gouge explained using microphysical model. J Geophys Res 121: 8642–8665. [CrossRef] [Google Scholar]
- Chen WP, Molnar P. 1983. Focal depths of intracontinental and intraplate earthquakes and their implications for the thermal and mechanical properties of the lithosphere. J Geophys Res Solid Earth 88: 4183–4214. [CrossRef] [Google Scholar]
- Correns CW. 1949. Growth and dissolution of crystals under linear pressure. Discuss Faraday Soc 5: 261–271. [Google Scholar]
- Cosgrove JW, Hudson JA. 2016. Structural Geology and Rock Engineering. Imperial college Press. [Google Scholar]
- Croize D, Renard F, Bjorlykke K, Dysthe DK. 2010. Experimental calcite dissolution under stress: evolution of grain contact microstructure during pressure solution creep. J Geophys Res Solid Earth 115: B09207. [Google Scholar]
- de Meer S, Spiers CJ, Nakashima S. 2005. Structure and diffusive properties of fluid-filled grain boundaries: an in-situ study using infrared (micro) spectroscopy. Earth Planet Sci Lett 232: 403–414. [CrossRef] [Google Scholar]
- den Brok SWJ. 1998. Effect of microcracking on pressure-solution strain rate: the Gratz grain-boundary model. Geology 26: 915–918. [CrossRef] [Google Scholar]
- Den Hartog SAM, Peach CJ, de Winter DAM, Spiers CJ, Shimamoto T. 2012. Frictional properties of megathrust fault gouges at low sliding velocities: new data on effects of normal stress and temperature. J Struct Geol 38: 156–171. [CrossRef] [Google Scholar]
- Dewers T, Ortoleva P. 1990. A coupled reaction / transport / mechanical model for intergranular pressure solution stylolites, and differential compaction and cementation in clean sandstones. Geochim Cosmochim Acta 54: 1609–1625. [CrossRef] [Google Scholar]
- Dumont T, Champagnac JD, Crouzet C, Rochat P. 2008. Multistage shortening in the Dauphiné zone (French Alps): the record of Alpine collision and implication for pre-Alpine restoration. Swiss J Geosci 101: 89–110. [CrossRef] [Google Scholar]
- Dysthe DK, Podladchikov Y, Renard F, Feder J, Jamtveit B. 2002. Universal scaling in transient creep. Phys Rev Lett 89. doi:10.1103/PhysRevLett.1189.246102 [Google Scholar]
- Dysthe DK, Renard F, Feder J, Jamtveit B, Meakin P, Jøssang T. 2003. High resolution measurments of pressure solution creep. Phys Rev E 68. doi: 10.1103/PhysRevE 1168.011603 [CrossRef] [Google Scholar]
- Ebner M, Koehn D, Toussaint R, Renard F, Schmittbuhl J. 2009. Stress sensitivity of stylolite morphology. Earth Planet Sci Lett 277: 394–398. [CrossRef] [Google Scholar]
- Elliott D. 1973. Diffusion flow laws in metamorphic rocks. Geol Soc Am Bull 84: 2645–2664. [CrossRef] [Google Scholar]
- Espinosa-Marzal RM, Scherer GW. Mechanisms of damage by salt. In Smith BJ, GomezHeras M, Viles HA, Cassar J, eds. Limestone in the Built Environment: Present Day Challenges for the Preservation of the Past 2010, pp. 61–77. [Google Scholar]
- Fischer GW, Elliott D. Criteria for quasi-steady diffusion and local equilibrium in metamorphism. In Hofmann AW, Giletti BJ, Yoder HS, Yund R, eds. Geochemical transports and kinetics. Carnegie Inst. Washington Publ., Washington 1974, pp. 77–89. [Google Scholar]
- Foulger GR, Wilson MP, Gluyas JG, Julian BR, Davies RJ. 2018. Global review of human-induced earthquakes. Earth Sci Rev 178: 438–514. [CrossRef] [Google Scholar]
- Ghoussoub J, Leroy YM. 2001. Solid-fluid phase transformation within grain boundaries during compaction by pressure solution. J Mech Phys Solids 49: 2385–2430. [CrossRef] [Google Scholar]
- Gibbs JW. 1877. On the equilibrium of heterogeneous substances. Trans Conn Acad 3: 108–248 and 343–524. [Google Scholar]
- Gidon M. 1998. GEOL-ALP, in: http://www.geol-alp.com C (Ed.). [Google Scholar]
- Goguel J. 1948. Introduction à l’étude mécanique des déformations de l’écorce terrestre. Memoire du service de la carte géologique de France, 540p. [Google Scholar]
- Gratier JP. 1993. Experimental pressure solution of halite by an indenter technique. Geophys Res Lett 20: 1647–1650. [CrossRef] [Google Scholar]
- Gratier JP. 2011. Fault permeability and strength evolution related to fracturing and healing episodic processes (years to millennia): the role of pressure solution. Oil Gas Sci Technol 3: 491–506. [CrossRef] [Google Scholar]
- Gratier JP, Dysthe DK, Renard F. 2013a. The role of pressure solution creep in the ductility of the Earth’s upper crust. Adv Geophys 54: 47–179. [Google Scholar]
- Gratier JP, Favreau P, Renard F. 2003. Modeling fluid transfer along California faults when integrating pressure solution crack sealing and compaction processes. J Geophys Res Solid Earth 108: 28–52. [CrossRef] [Google Scholar]
- Gratier JP, Frery E, Deschamps P, et al. 2012. How travertine veins grow from top to bottom and lift the rocks above them: the effect of crystallization force. Geology in press [Google Scholar]
- Gratier JP, Gamond JF. Transition between seismic and aseismic deformation in the upper crust. In: Knipe RJR, E. H. ed. Deformation Mechanisms, Rheology and Tectonics. Geological Society Special Publication, 1990, pp. 461–473. [Google Scholar]
- Gratier JP, Gueydan F. Deformation in the presence of fluids and mineral reactions: effect of fracturing and fluid-rock interaction on seismic cycles. In Handy MR, Hirth G, Hovius N, Workshop D, eds. Tectonic Faults: agent of change on a dynamic earth. Cambridge Mass, USA: The MIT Press, 2007, pp. 319–356. [CrossRef] [Google Scholar]
- Gratier JP, Guiguet R, Renard F, Jenatton L, Bernard D. 2009. A pressure solution creep law for quartz from indentation experiments. J Geophys Res Solid Earth 114. doi:10.1029/2008 JB005652. [CrossRef] [Google Scholar]
- Gratier JP, Guillier B, Delorme A. 1991. Restoration and balance of a folded and faulted surface by best-fitting of finite elements: principle and applications. J Struct Geol 13: 111–115. [CrossRef] [Google Scholar]
- Gratier JP, Hopps T, Sorlien C, Wright T. 1999a. Recent crustal deformation in Southern California deduced from the restoration of folded and faulted strata. J Geophys Res Solid Earth 104: 4887–4899. [CrossRef] [Google Scholar]
- Gratier JP, Menegon L, Renard F. 2023. Pressure solution grain boundary sliding as a large strain mechanism of superplastic flow in the upper crust. J Geophys Res Solid Earth 128: e2022J B026019. [CrossRef] [Google Scholar]
- Gratier JP, Muquet L, Hassani R, Renard F. 2005. Experimental microstylolites in quartz and modeled application to natural stylolitic structures. J Struct Geol 27: 89–100. [CrossRef] [Google Scholar]
- Gratier JP, Noiriel C, Renard F. 2015. Experimental evidence for rock layering development by pressure solution. Geology 43: 871–874. [CrossRef] [Google Scholar]
- Gratier JP, Renard F, Labaume P. 1999b. How pressure solution creep and fracturing processes interact in the upper crust to make it behave in both a brittle and viscous manner. J Struct Geol 21: 1189–1197. [CrossRef] [Google Scholar]
- Gratier JP, Renard F, Vial B. 2014. Postseismic pressure solution creep: evidence and time-dependent change from dynamic indenting experiments. J Geophys Res Solid Earth 119. [Google Scholar]
- Gratier JP, Richard J, Renard FS, et al. 2011. Aseismic sliding of active faults by pressure solution creep: evidence from the San Andreas Fault Observatory at Depth. Geology 39: 1131–1134. [CrossRef] [Google Scholar]
- Gratier JP, Thouvenot F, Jenatton L, Tourette A, Doan M-L., Renard F. 2013b. Geological control of the partitioning between seismic and aseismic sliding behaviour in active faults: evidence from the Western Alps, France. Tectonophysics 600: 226–242 [CrossRef] [Google Scholar]
- Gratier JP, Vialon P. 1980. Deformation pattern in a heterogeneous material: folded and cleaved sedimentary cover immediately overlying a crystalline basement (Oisans, French Alps). Tectonophysics 65: 151–180. [CrossRef] [Google Scholar]
- Gratz AJ. 1991. Solution-transfer compaction of quartzites: progress toward a rate law. Geology 19: 901–904. [CrossRef] [Google Scholar]
- Heald MT. 1955. Stylolites in sandstones. J Geol 63: 101–114. [CrossRef] [Google Scholar]
- Heidug WK, Leroy YM. 1994. Geometrical evolution of stressed and curved solid-fluid phase boundary. 1. Transformation kinetics. J Geophys Res Solid Earth 99: 505–515. [CrossRef] [Google Scholar]
- Hickman SH, Evans B. 1995. Kinetics of pressure solution at halite-silica interfaces and intergranular clay films. J Geophys Res 100: 13113–13132. [CrossRef] [Google Scholar]
- Hobbs BE, Means WD, Williams PF. 1976. An outline of structural geology. Wiley and Sons. [Google Scholar]
- Hunfeld LB, Chen J, Hol S, Niemeijer AR, Spiers CJ. 2020. Healing behavior of simulated fault gouges from the Groningen gas field and implications for induced fault reactivation. J Geophys Res: Solid Earth 125: e2019J B018790. [CrossRef] [Google Scholar]
- Kaduri M, Gratier JP, Lasserre C, Cakir Z, Renard F. 2019. Quantifying the partition between seismic and sseismic deformation along creeping and locked sections of the North Anatolian Fault, Turkey. Pure Appl Geophys 176: 1293–1321. [CrossRef] [Google Scholar]
- Kelemen PB, Hirth G. 2012. Reaction-driven cracking during retrograde metamorphism: olivine hydration and carbonation. Earth Planet Sci Lett 345–348: 81–89. [Google Scholar]
- Kingery WD, Bowen HK, Ulhmann DR. 1976. Introduction to ceramics, 2nd ed. New York: Wiley-Interscience, John Wiley & Sons. [Google Scholar]
- Lehner FK. 1995. A model for intergranular pressure solution in open systems. Tectonophysics 245: 153–170. [CrossRef] [Google Scholar]
- Lehner FK, Bataille J. 1985. Nonequilibrium thermodynamics of pressure solution. PAGEOPH 122: 53–85. [CrossRef] [Google Scholar]
- Malvoisin B, Baumgartner LP. 2021. Mineral dissolution and precipitation under stress: model formulation and application to metamorphic reactions. Geochem Geophys Geosyst 22. [CrossRef] [Google Scholar]
- McEwen TJ. 1978. Diffusional mass transfer process in pitted pebble conglomerates. Contrib Mineral Petrol 67: 405–415. [CrossRef] [Google Scholar]
- Meyer EE, Greene GW, Alcantar NA, Israelachvili JN, Boles JR. 2006. Experimental investigation of the dissolution of quartz by a muscovite mica surface: implications for pressure solution. J Geophys Res 111, doi:10.1029/2005 JB004010. [Google Scholar]
- Moore DE, Lockner DA. 2007. Friction of the smectite clay montmorillonite: a review and interpretation of data. De Gruyter. [Google Scholar]
- Moore DE, Rymer MJ. 2007. Talc-bearing serpentinite and the creeping section of the San Andreas fault. Nature 448: 795–797. [CrossRef] [Google Scholar]
- Niemeijer AR, Spiers CJ. 2007. A microphysical model for strong velocity weakening in phyllosilicate-bearing fault gouges. J Geophys Res 112: B10405. [Google Scholar]
- Noiriel C, Renard F, Doan ML, Gratier JP. 2010. Intense fracturing and fracture sealing induced by mineral growth in porous rocks. Chem Geol 269: 197–209. [CrossRef] [Google Scholar]
- Paterson MS. 1973. Nonhydrostatic thermodynamics and its geologic applications. Rev Geophys Space Phys 11: 355–389. [CrossRef] [Google Scholar]
- Paterson MS. 1978. Experimental rock deformation: the brittle field. Berlin: Springer-Verlag. [Google Scholar]
- Pfiffner OA. 2017. Thick-skinned and thin-skinned tectonics: a global perspective. Geosciences 7: 71. [CrossRef] [Google Scholar]
- Poirier JP. 1985. Creep of crystals. Cambridge University Press. [Google Scholar]
- Raj R, Chyung CK. 1981. Solution-precipitation creep in glass ceramics. Acta Metall 29: 159–166. [CrossRef] [Google Scholar]
- Ramsay JG. 1967. Folding and fracturing of rocks. MacGraw-Hill Book Company. [Google Scholar]
- Ramsay JG. 1980. The crack-seal mechanism of rock deformation. Nature 284: 135–139. [Google Scholar]
- Renard F, Gratier JP, Jamtveit B. 2000. Kinetics of crack-sealing, intergranular pressure solution, and compaction around active faults. J Struct Geol 22: 1395–1407. [CrossRef] [Google Scholar]
- Renard F, Ortoleva P. 1997. Water films at grain-grain contacts: Debye-Huckel, osmotic model of stress, salinity, and mineralogy dependence. Geochim Cosmochim Acta 61: 1963–1970. [CrossRef] [Google Scholar]
- Renard F, Ortoleva P, Gratier JP. 1997. Pressure solution in sandstones: influence of clays and dependence on temperature and stress. Tectonophysics 280: 257–266. [CrossRef] [Google Scholar]
- Renard F, Park A, Ortoleva P, Gratier JP. 1999. An integrated model for transitional pressure solution in sandstones. Tectonophysics 312: 97–115. [CrossRef] [Google Scholar]
- Rolland A, Toussaint R, Baud P, et al. 2012. Modeling the growth of stylolites in sedimentary rocks. J Geophys Res Solid Earth 117: B06403. [CrossRef] [Google Scholar]
- Ruiz-Agudo E, Putnis CV, Putnis A. 2014. Coupled dissolution and precipitation mineral-fluid interfaces. Chem Geol 383: 132–146. [CrossRef] [Google Scholar]
- Rutter EH. 1976. The kinetics of rock deformation by pressure solution. Philos Trans Royal Soc London 283: 203–219. [Google Scholar]
- Rutter EH. 1983. Pressure solution in nature, theory and experiment. J Geol Soc London 140: 725–740. [CrossRef] [Google Scholar]
- Rutter EH, Mainprice DH. 1978. The effect of water on stress relaxation of faulted and unfaulted sandstones. Pure Appl Geophys 116: 634–654. [CrossRef] [Google Scholar]
- Rutter EH, Mainprice DH. 1979. On the possibility of slow fault slip controlled by a diffusive mass transfer process Gerlands Beiträge zur Geophysik 88: 154–162. [Google Scholar]
- Schmid SM, Boland JN, Paterson MS. 1977. Superplastic flow in finegrained limestone. Tectonophysics 43: 257–291. [CrossRef] [Google Scholar]
- Schmittbuhl J, Renard F, Gratier JP, Toussaint R. 2004. Roughness of stylolites: implication of 3D high resolution topography measurements. Phys Rev Lett 93. [Google Scholar]
- Scholtz CH. 1998. Earthquakes and friction laws. Nature 391: 37–42. [CrossRef] [Google Scholar]
- Schutjens P, Spiers CJ. 1999. Intergranular pressure solution in NaCl: Grain-to-grain contact experiments under the optical microscope. Oil Gas Sci Technol-Revue De L Institut Francais Du Petrole 54: 729–750. [CrossRef] [Google Scholar]
- Schutjens P, Spiers CJ, Niemeijer A. 2021. Surface microstructures developed on polished quartz crystals embedded in wet quartz sand compacted under hydrothermal conditions. Sci Rep 11: 14920. [CrossRef] [Google Scholar]
- Shimizu I. 1992. Nonhydrostatic and nonequilibrium thermodynamics of deformable materials. J Geophys Res Solid Earth 97: 4587–4597. [CrossRef] [Google Scholar]
- Sibson RH. 1982. Fault zone models, heat flow, and the depth distribution of earthquakes in the continental crust of the United States. Bull Seismol Soc Am 72: 151–163. [Google Scholar]
- Smith DL, Evans B. 1984. Diffusional crack healing in quartz. J Geophys Res 89: 4125–4135. [CrossRef] [Google Scholar]
- Sorby HC. 1863. On the direct correlation of mechanical and chemical forces. Proc Royal Soc London 12: 538–550. [CrossRef] [Google Scholar]
- Spiers CJ, Brzesowsky RH. 1993. Densification behaviour of wet granular salt: theory versus experiment, Seventh Symposium on salt, pp. 83–91. [Google Scholar]
- Spiers CJ, De Meer S, Niemeijer AR, Zhang X. Kinetics of rock deformation by pressure solution and the role of thin aqueous films. In Nakashima S, Spiers CJ, Mercury L, Fenter PA, Hochella MF, eds. Physicochemistry of water in geological and biological systems. Tokyo: Universal Academy Press, 2004, pp. 129–158. [Google Scholar]
- Steiger M. 2005. Crystal growth in porous materials −I: The crystallization pressure of large crystals. J Cryst Growth 282: 455–459. [CrossRef] [Google Scholar]
- Suppe J. 1985. Principe of structural geology. Prentice-Hall. [Google Scholar]
- Taber S. 1916. The growth of crystals under external pressure. Am J Sci XLI, 532–556. [CrossRef] [Google Scholar]
- Tenthorey E, Cox SF. 2006. Cohesive strengthening of fault zones during the interseismic period: an experimental study. J Geophys Res Solid Earth 111: 59–72. [CrossRef] [Google Scholar]
- Thibert B, Gratier JP, J.M. M. 2005. A direct method for modeling developable strata and its geological application to Ventura Basin (California). J Struct Geol 27: 303–316. [CrossRef] [Google Scholar]
- Thomson J. 1861. Collected papers in physics and engineering. Cambridge university press, p. 1912. [Google Scholar]
- Toussaint R, Aharonov E, Koehn D, et al. 2018. Stylolites: a review. J Struct Geol 114: 163–195. [CrossRef] [Google Scholar]
- Urai JL, Spiers CJ, Peach CJ, Franssen R, Liezenberg JL. 1987. Deformation mechanisms operating in naturally defomed halite rocks as deduced from microstructural investigations. Geologie En Mijnbouw 66: 165–176. [Google Scholar]
- van Noort R, Spiers C, Peach C. 2007. Effects of orientation on the diffusive properties of fluid-filled grain boundaries during pressure solution. Phys Chem Miner 34: 95–112. [Google Scholar]
- van Noort R, Spiers CJ. 2009. Kinetic effects of microscale plasticity at grain boundaries during pressure solution. J Geophys Res Solid Earth 114. [Google Scholar]
- van Noort R, Visser HJM, Spiers CJ. 2008. Influence of grain boundary structure on dissolution controlled pressure solution and retarding effects of grain boundary healing. J Geophys Res Solid Earth 113, doi:10.1029/2007JB005223 [Google Scholar]
- Van Oosterhout BGA, Hangx SJT, Spiers CJ. 2022. A threshold stress for pressure solution creep in rock salt: model predictions vs. observations. CRC Press. [Google Scholar]
- Verberne BA, van den Ende MPA, Chen J, Niemeijer AR, Spiers CJ. 2020. The physics of fault friction: insights from experiements on simulated gouges at low shearing velocities. J Geophys Res Solid Earth 11: 2075–2095. [Google Scholar]
- Weyl PK. 1959. Pressure solution and the force of crystallization: a phenomenological theory. J Geophys Res Solid Earth 64: 2001–2025. [CrossRef] [Google Scholar]
- Wintsch RP, Christoffersen R, Kronenberg AK. 1995. Fluid-rock reaction weakening of fault zones. J Geophys Res 100: 13021–13032. [CrossRef] [Google Scholar]
- Wintsch RP, Dunning J. 1985. The effect of dislocation density on the aqueous solubility of quartz and some geologic implications: a theoretical approach. J Geophys Res Solid Earth 90: 3649–3657. [CrossRef] [Google Scholar]
- Wintsch RP, Keewook Y. 2002. Dissolution and replacement creep: a significant deformation mechanism in mid-crustal rocks. J Struct Geol 24: 1179–1193. [CrossRef] [Google Scholar]
- Wolterbeek TKT, van Noort R, Spiers CJ. 2018. Reaction-driven casing expansion: potential for wellbore leakage mitigation. Acta Geotech 13: 341–366. [Google Scholar]
- Yasuhara H, Marone C, Elsworth D. 2005. Fault zone restrengthening and frictional healing: the role of pressure solution. J Geophys Res Solid Earth 110, doi:101029/102004 JB003327. [CrossRef] [Google Scholar]
- Zhang XM, Spiers CJ. 2005. Compaction of granular calcite by pressure solution at room temperature and effects of pore fluid chemistry. Int J Rock Mech Min Sci 42: 950–960. [CrossRef] [Google Scholar]
- Zhang XM, Spiers CJ, Peach CJ. 2010. Compaction creep of wet granular calcite by pressure solution at 28 degrees C to 150 degrees C. J Geophys Res Solid Earth 115, doi:10.1029/2008 JB005853. [Google Scholar]
- Zhang XM, Spiers CJ, Peach CJ. 2011. Effects of pore fluid flow and chemistry on compaction creep of calcite by pressure solution at 150 degrees C. Geofluids 11: 108–122. [CrossRef] [Google Scholar]
- Zubtsov S, Renard F, Gratier JP, Guiguet R, Dysthe DK, Traskine V. 2004. Experimental pressure solution compaction of synthetic halite/calcite aggregates. Tectonophysics 385: 45–57. [CrossRef] [Google Scholar]
Cite this article as: Jean-Pierre Gratier. How the Earth’s upper crust deforms in a viscous or brittle manner and how these behaviors interact and evolve over time: the crucial role of pressure solution creep and sealing processes Rev. Fr. Geotech. 2023, 177, 4.
All Figures
|
Fig. 1 (a) Dynamics of the Earth. (b) Distribution of earthquakes through the upper crust in western USA; (c) strength versus depth model for quartz-bearing and feldspathic rocks (Sibson, 1982). (d) Folds and faults in cross sections through mountain ranges, (Pfiffner, 2017). (e) Fold and fault coupled development (Suppe, 1985). Dynamique de la Terre. (b) Distribution des tremblements de terre dans la croûte supérieure de l’ouest des États-Unis ; (c) modèle de résistance en fonction de la profondeur pour les roches quartzifères et feldspathiques (Sibson, 1982). (d) Plis et failles dans des coupes transversales de chaînes de montagnes, (Pfiffner, 2017). (e) Développement couplé de plis et de failles (Suppe, 1985). |
| In the text | |
|
Fig. 2 Pressure solution markers in flexural folds: (a) cross section through the Western Alps; (b) pitted pebbles; (c) tectonic stylolites and veins with Al, Si and Ca distribution contents; (d) mineral fibers and slickolites along sliding fault or strata; (e) pressure solution at micro blocks scale in flexural folding with example from the Western Alps. (f) Finite displacements field associated with folds and faults of the Transverse Ranges (California), with detail to the left, evaluated from unfolding methods (Gratier et al. 1999a, Thibert et al. 2005). Marqueurs de pression solution dans les plis flexuraux : (a) coupe transversale à travers les Alpes occidentales ; (b) galets impressionnés ; (c) stylolites et veines tectoniques avec distributions des teneurs en Al, Si et Ca ; (d) fibres minérales et slickolites le long des glissements de failles ou de strates ; (e) pression solution à l’échelle des micro-blocs dans les plis flexuraux avec exemple des Alpes occidentales. (f) Champ de déplacements finis associés aux plis et aux failles des Transverse Ranges (Californie), avec détail à gauche, évalués à partir de méthodes de dépliage (Gratier et al. 1999a, Thibert et al. 2005). |
| In the text | |
|
Fig. 3 Pressure solution markers in similar folds: (a) cross section through the Western Alps; (b) slaty and spaced cleavages (left) and tectonic segregation by pressure solution around a rigid object (right); (c) spaced cleavage and tectonic layering; (d) large deformation (red ellipse) by grain boundary sliding of near equant very fine grains (grain size diagram and blue ellipse); (e) schematic evolution of pressure grain boundary sliding by dissolution (gray) and redeposition (white), (Gratier et al. 2023). Marqueurs de pression solution dans des plis semblables : (a) coupe transversale dans les Alpes occidentales ; (b) schistosité espacée et de flux (gauche) et ségrégation tectonique par pression solution autour d’un objet rigide (à droite) ; (c) schistosité espacée et litage tectonique ; (d) grande déformation (ellipse rouge) par glissement aux joints de grains très fins presque équants (ellipse bleue et diagramme de tailles) ; (e) évolution schématique du glissement aux joints de grains par pression solution avec dissolution (gris) et redéposition (blanc), (Gratier et al. 2023). |
| In the text | |
|
Fig. 4 Pressure solution markers in shear zones: (a) map view of the North Anatolian Fault with seismic and aseismic sliding; (b) pressure solution creep with stylolites, fractures and sealing in seismic zones; (c) pressure solution grain boundary sliding within kilometric width damage zones and (d) within metric width gouges; (e) view of damage zones and gouges in quarry, (Kaduri et al. 2019). (f) Rocks strength versus depth diagram including the three main mechanisms of deformation in the upper crust (Gratier & Gamond 1990). Marqueurs de pression solution dans les zones de cisaillement : (a) carte de la faille nord-anatolienne avec glissement sismique et asismique ; (b) fluage par pression solution avec stylolites, fractures et colmatage dans des zones sismiques (c) fluage par pression solution par glissement aux joints de grains dans des zones d’endommagement de largeur kilométrique et (d) dans les gouges métriques ; (e) zones d’endommagement et gouges dans une carrière, (Kaduri et al. 2019). (f) Résistance des roches en fonction de la profondeur avec les trois principaux mécanismes de déformation de la croûte supérieure (Gratier et Gamond 1990). |
| In the text | |
|
Figure 5 Pressure solution basic concepts and indenter experiments: (a) driving forces of pressure solution; (b) force of crystallization; (c) various models of trapped fluid phases under stress (Gratier et al. 2013a). (d) Indenter experiments showing the difference between like or unlike contacts (Hickman and Evans 1995). (e) Experimental microstylolites (top) and their development rooted on dislocations (bottom), (Gratier et al. 2005). (f) Self-affine scaling invariance of natural stylolites with Hurst exponents from 0.5 to 1.2 with cross over value (Lc) characteristic of the stress magnitude during the stylolites growth (Schmittbuhl et al. 2004). Concepts de base de la pression solution et expériences d’indentation : (a) forces motrices de la pression solution ; (b) force de cristallisation ; (c) divers modèles de phases fluides piégées sous contrainte (Gratier et al. 2013a). (d) Expériences d’indentation montrant la différence entre des contacts similaires ou différents (Hickman et Evans 1995). (e) Microstylolites expérimentaux (en haut) et leur développement enraciné sur des dislocations (en bas), (Gratier et al. 2005). (f) Invariance d’échelle auto-affine des stylolites naturels avec des exposants de Hurst de 0,5 à 1,2 avec une valeur de croisement (Lc) caractéristique de l’ampleur de la contrainte pendant la croissance des stylolites (Schmittbuhl et al. 2004). |
| In the text | |
|
Figure 6 Pressure solution indenter experiments: (a) data for pressure solution creep law from indenter experiments (center) in various conditions (left) and various roughness of the dissolution surfaces (right) (Gratier et al. 2009). (b) Indenter experiments with change of stress (Dysthe et al, 2002, Gratier et al. 2014). (c) Schematic evolution of the fluid phases trapped under stress over time. (d) Accelerating effect of the fracturing on pressure solution indenting experiment (Gratier 1993) and predicted slow fracture healing (dashed red line). Expériences de pression solution par indentation : (a) données pour une loi de fluage par pression solution issue d’expériences d’indentation (centre) dans diverses conditions (gauche) et diverses rugosités des surfaces de dissolution (droite) (Gratier et al. 2009). (b) Expériences d’indentation avec changement de contrainte (Dysthe et al. 2002, Gratier et al. 2014). (c) Evolution schématique des phases fluides piégées sous contrainte au cours du temps. (d) Effet accélérateur de fracturation dans une expérience d’indentation par pression solution (Gratier 1993) et cicatrisation lente prédite de la fracture (pointillés rouges). |
| In the text | |
|
Figure 7 Pressure solution experiments on aggregates : (a) evolution of the rate limiting process with fluid flow composition change from pure or saline solutions (diffusion-controlled compaction) to solutions with phosphate or Mg2+ (reaction rate-controlled compaction) (Zhang et al. 2011). (b) Rock layering development in aggregate of plaster (gypsum, orange) and clay (green) with self-organized propagation of dissolution seams (red lines, bottom) from weakened zones rich in clays (center) and around strengthened zones rich in gypsum (right) (Gratier et al. 2015). Expériences de pression solution d’agrégats : (a) évolution du processus limitant avec le changement de composition du fluide en écoulement de solutions pure ou saline (compaction contrôlée par la diffusion) à des solutions avec du phosphate ou du Mg2+ ; (compaction contrôlée par la vitesse de réaction) (Zhang et al. 2011). (b) Développement de litage dans un agrégat de plâtre (gypse, orange) et d’argile (vert) avec propagation auto-organisée de joints de dissolution (lignes rouges, en bas) à partir de zones affaiblies riches en argiles (au centre) et autour de zones durcies riches en gypse (à droite) (Gratier et al. 2015). |
| In the text | |
|
Figure 8 Superplastic deformation by pressure solution: (a) in parallel ductile (fine grains shale, Gratier et al. 2013) and brittle deformation (large grains granitoid, Bellanger et al. 2014), Alps; (b) pressure solution grain boundary sliding model for large deformation with mass transfer from the most to the less stressed areas; (c) deformation maps using Dw values from experiments; (d) deformation maps using Dw values with a slowness coefficient leading to a decrease of Dw values as stress decreases (Gratier et al., 2023). (e) Pressure solution creep model by stylolites and fractures in granitoids and limestones (Gratier et al. 2003, Kaduri et al. 2019), (f) with this model: stress evolution with time at constant strain rate (Gratier et al. 1999b). Déformation superplastique par pression solution : (a) déformation ductile (schiste, grains fins, Gratier et al. 2023) en parallèle avec une déformation fragile (granitoïde, gros grains, Bellanger et al. 2014), Alpes ; (b) modèle de glissement aux joints de grains par pression solution pour grandes déformations avec transfert de matières des zones les plus contraintes vers les zones les moins contraintes ; (c) cartes de déformation utilisant les valeurs Dw des expériences ; (d) cartes de déformation utilisant les valeurs Dw avec un coefficient de lenteur entrainant une diminution de Dw avec la diminution des contraintes, (Gratier et al. 2023). (e) Modèle de fluage par pression solution avec stylolites et fractures dans granitoïdes ou calcaires (Gratier et al. 2003, Kaduri et al. 2019), (f) avec ce modèle: évolution de la contrainte avec le temps à vitesse de déformation constante (Gratier et al. 1999b). |
| In the text | |
|
Figure 9 Post seismic pressure solution creep and sealing: (a) various types of fracture sealing (Gratier and Gueydan 2007) from fast self-healing to sealing associated with fluid flow up to slow diffusion-controlled fractures sealing with exponential decrease of porosity and permeability (Renard et al. 2000). (b) Calculation of fluid pressure evolution from hydrostatic to lithostatic values (Gratier et al. 2003) depending on the minerals. (c) Natural example of the force of crystallization in veins with top to bottom growth that uplift the 10-20m of rocks above (Gratier et al. 2012). (d) Evolution of the duration of the seismic cycles depending on the rate of fault healing and strengthening (Gratier and Gueydan 2007). Fluage et colmatage post sismique par pression solution: (a) différents types de colmatage (Gratier et Gueydan 2007) de l’auto-cicatrisation rapide au colmatage associé à des écoulements de fluides jusqu’au lent colmatage des fractures contrôlé par diffusion avec diminution exponentielle de la porosité et de la perméabilité (Renard et al. 2000). (b) Calcul de l’évolution de pression des fluides de valeurs hydrostatiques à lithostatique en fonction des minéraux (Gratier et al. 2003). (c) Exemple naturel de force de cristallisation dans des veines avec croissance de haut en bas qui soulève les 10-20m de roches au-dessus (Gratier et al. 2012). (d) Evolution de la durée des cycles sismiques en fonction du taux de cicatrisation et du durcissement des failles (Gratier et Gueydan 2007). |
| In the text | |
|
Figure 10 Summary of markers and models of pressure solution creep and sealing in the upper crust: (a) superplastic creep by grain boundary sliding ; (b) creep by the coupling of stylolites and fractures ; (c) creep by the coupling of grains - pebbles indenting and fracturing. (d) Post seismic pressure solution fault sealing and long term input and output of fluids in seismic fault zones. (e) Force of crystallization that uplifts the rocks above. (f) Rocks strength versus depth diagram for the three main mechanisms of deformation of the upper crust with various evolutions for pressure solution creep (bottom) depending on the composition and the structure of the rocks (top). Résumé des marqueurs et des modèles de fluage et de colmatage par pression solution dans la croûte supérieure : (a) fluage superplastique par glissement aux joints de grains ; (b) fluage par le couplage de stylolites et fractures ; (c) fluage par le couplage d’indentation de grains - galets et fracturation. (d) Colmatage post sismique des failles par pression solution et entrée et sortie de fluides à long terme dans les zones de failles sismiques. (e) Force de cristallisation qui soulève les roches au-dessus. (f) Diagramme de résistance des roches en fonction de la profondeur pour les trois principaux mécanismes de déformation de la croûte supérieure avec diverses évolutions pour le fluage par pression solution (bas) en fonction de la composition et de la structure des roches (haut). |
| In the text | |
Current usage metrics show cumulative count of Article Views (full-text article views including HTML views, PDF and ePub downloads, according to the available data) and Abstracts Views on Vision4Press platform.
Data correspond to usage on the plateform after 2015. The current usage metrics is available 48-96 hours after online publication and is updated daily on week days.
Initial download of the metrics may take a while.