")
")
Fig. 5
Download original image
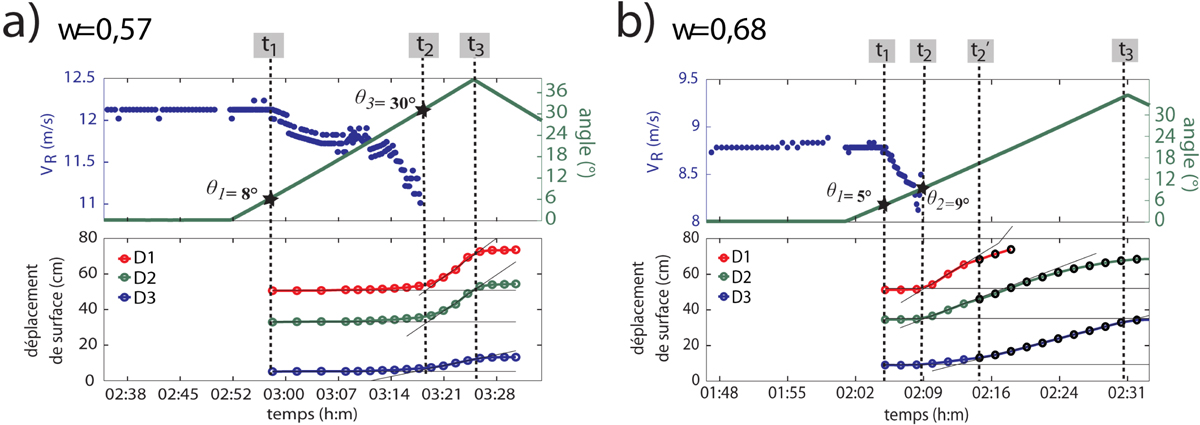
Expériences de plan incliné : a : teneur en eau w = 0,57 ; b : teneur en eau w = 0,68. (Haut) Vitesse des ondes de Rayleigh (VR, points bleus) et angle du plan incliné (ligne verte) en fonction du temps. (Bas) Déplacements de surface mesurés aux points D1, D2 et D3. t1, t2, t2' et t3 repèrent des temps caractéristiques (cf. texte).
Laboratory inclined plane experiments: a: water content w = 0.57; b: w = 0.68. (Top) Rayleigh wave velocity (VR, blue dots) and plane inclination (green line) over time. (Bottom) Surface displacement at D1, D2 and D3 markers. t1, t2, t2' and t3 points show the characteristic times described in the main text.
Current usage metrics show cumulative count of Article Views (full-text article views including HTML views, PDF and ePub downloads, according to the available data) and Abstracts Views on Vision4Press platform.
Data correspond to usage on the plateform after 2015. The current usage metrics is available 48-96 hours after online publication and is updated daily on week days.
Initial download of the metrics may take a while.