")
")
Fig. 8
Download original image
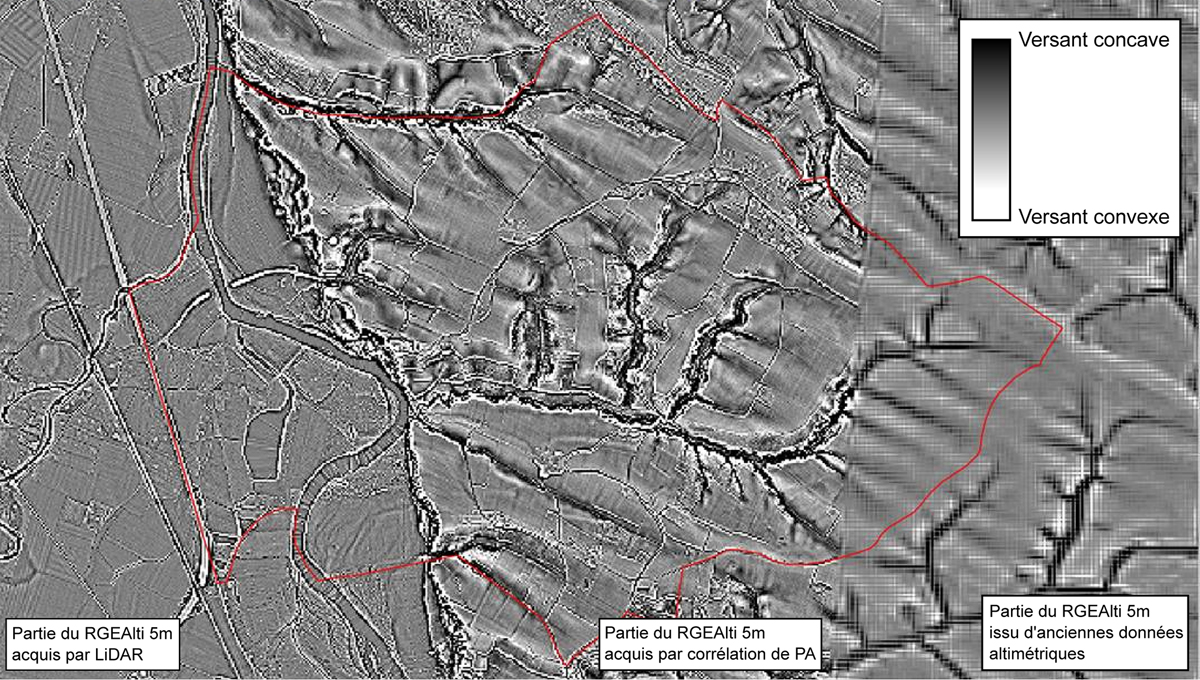
Exemple de problèmes liés au RGEAlti®5 m issus d’un assemblage de plusieurs techniques et données altimétriques hétérogènes sur la commune de Clermont-le-Fort (31). La carte représente une dérivée (le degré de courbure représentée en nuances de gris) issue du même MNT.
Example of problems related to the DTM RGEAlti®5 m resulting from a merge elevation data from several techniques and heterogeneous database (location: municipality of Clermont-le-Fort – 31). The map represents a derivative (curvature is represented by grey shades) from the same DTM.
Current usage metrics show cumulative count of Article Views (full-text article views including HTML views, PDF and ePub downloads, according to the available data) and Abstracts Views on Vision4Press platform.
Data correspond to usage on the plateform after 2015. The current usage metrics is available 48-96 hours after online publication and is updated daily on week days.
Initial download of the metrics may take a while.