")
")
Free Access
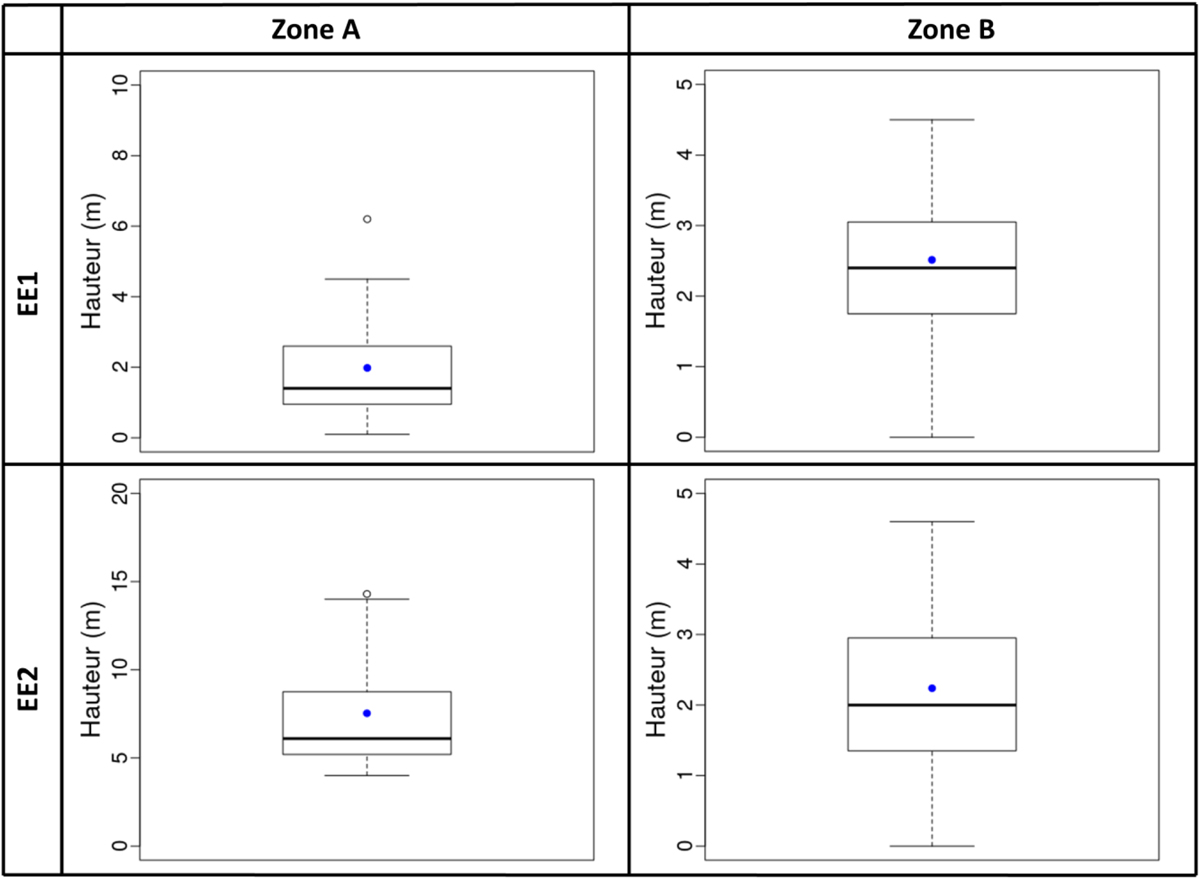
Fig. 9
Download original image
Diagramme en boîte représentant la distribution des hauteurs « extrêmes » fournies par les participants. Le point bleu représente la moyenne de cette distribution.
Boxplot* depicting the distribution of the “extreme” passing heights provided by the participants. The blue point is the mean of this distribution.
Current usage metrics show cumulative count of Article Views (full-text article views including HTML views, PDF and ePub downloads, according to the available data) and Abstracts Views on Vision4Press platform.
Data correspond to usage on the plateform after 2015. The current usage metrics is available 48-96 hours after online publication and is updated daily on week days.
Initial download of the metrics may take a while.