")
")
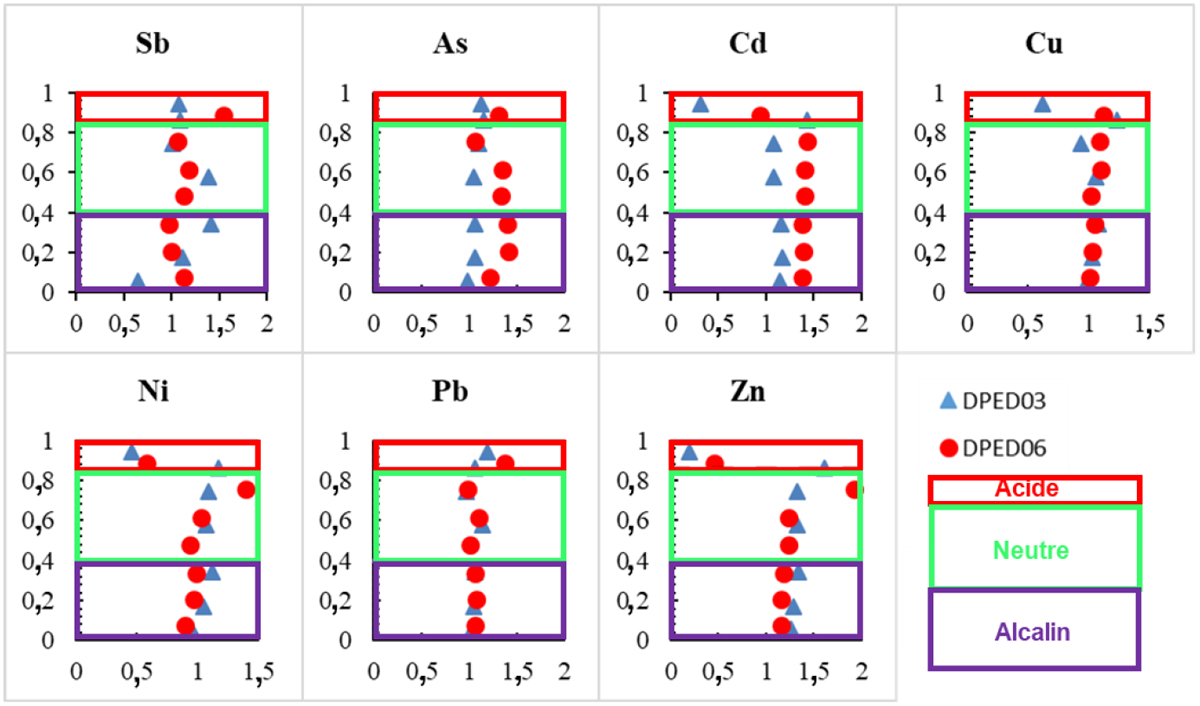
Fig. 5
Download original image
Profil spatial montrant la concentration des ETM dans l’épaisseur des sédiments. L’axe des x montre la concentration normalisée (concentration finale/concentration initiale), et l’axe des y montre l’épaisseur normalisée des sédiments (0 est la cathode et 1 est l’anode).
Spatial profile showing concentration of trace metals in sediment in the thickness of sediment. The x-axis shows the normalized concentration (final concentration/initial concentration), and the y-axis shows the normalized sediment thickness (0 is the cathode and 1 is the anode).
Current usage metrics show cumulative count of Article Views (full-text article views including HTML views, PDF and ePub downloads, according to the available data) and Abstracts Views on Vision4Press platform.
Data correspond to usage on the plateform after 2015. The current usage metrics is available 48-96 hours after online publication and is updated daily on week days.
Initial download of the metrics may take a while.