")
")
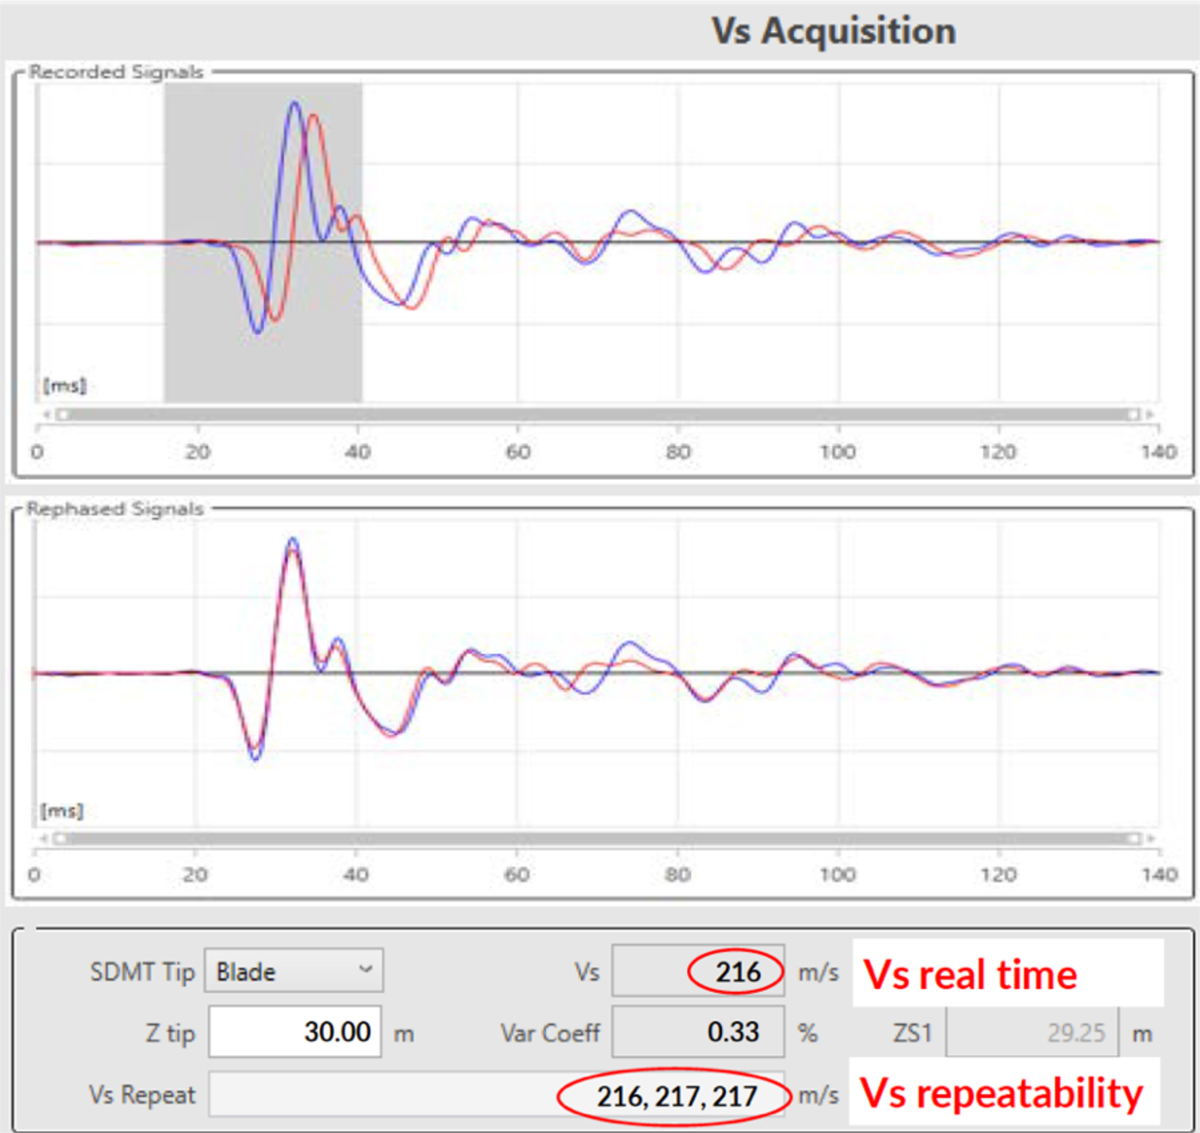
Fig. 4
Download original image
Example true-time interval SCPTu data acquisition showing two arrival waves from a single source in the upper plot and the cross-correlation shift in the lower plot (modified from Marchetti, 2022).
Exemple d’acquisition de données SCPTu à intervalle de temps réel montrant deux arrivées d’ondes depuis une seule source (graphique supérieur) et le décalage de la corrélation croisée (graphique inférieur) (modifié d’après Marchetti, 2022).
Current usage metrics show cumulative count of Article Views (full-text article views including HTML views, PDF and ePub downloads, according to the available data) and Abstracts Views on Vision4Press platform.
Data correspond to usage on the plateform after 2015. The current usage metrics is available 48-96 hours after online publication and is updated daily on week days.
Initial download of the metrics may take a while.