")
")
Free Access
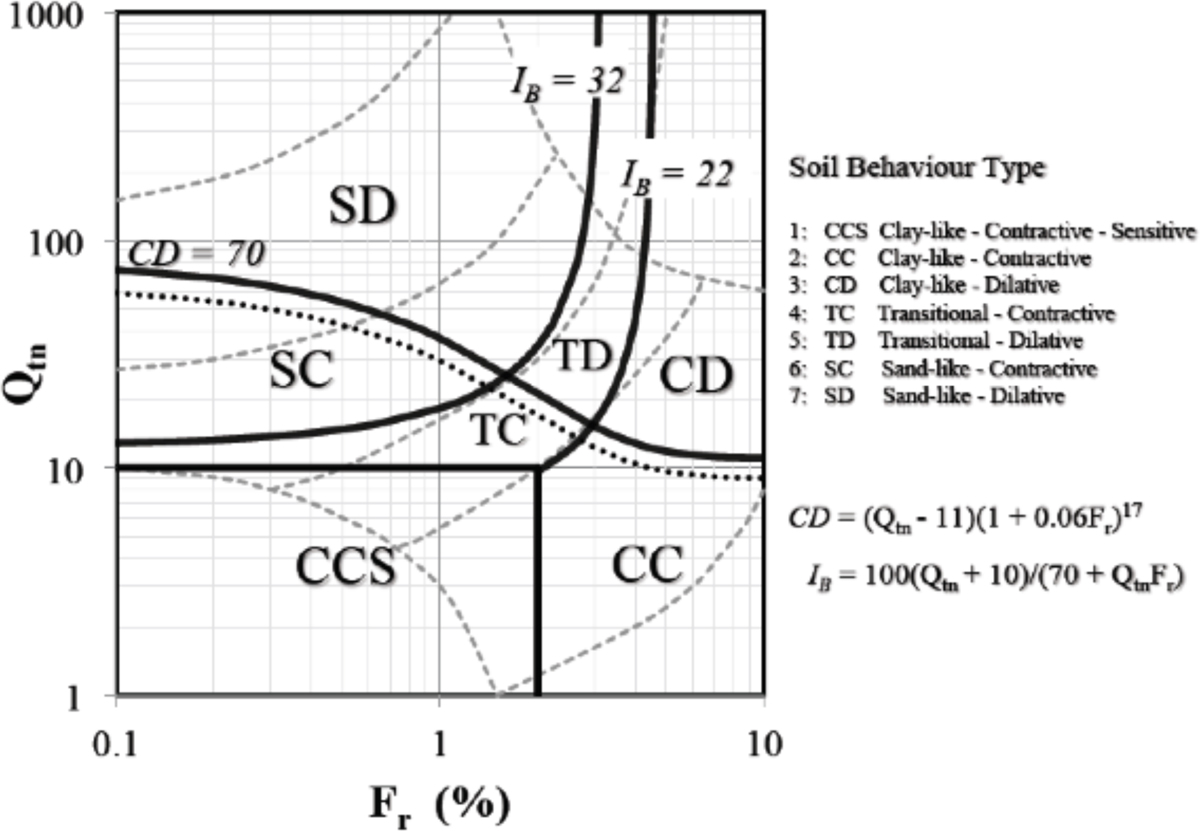
Fig. 7
Download original image
SBTn chart for ideal soils based on Qtn − Fr (After Robertson, 2016) (dashed lines represent SBT zones from Robertson, 1990).
Abaque SBTn pour les sols idéaux basée sur Qtn − Fr (d’après Robertson, 2016) (les lignes en tireté représentent les zones SBT d’après Robertson, 1990).
Current usage metrics show cumulative count of Article Views (full-text article views including HTML views, PDF and ePub downloads, according to the available data) and Abstracts Views on Vision4Press platform.
Data correspond to usage on the plateform after 2015. The current usage metrics is available 48-96 hours after online publication and is updated daily on week days.
Initial download of the metrics may take a while.