")
")
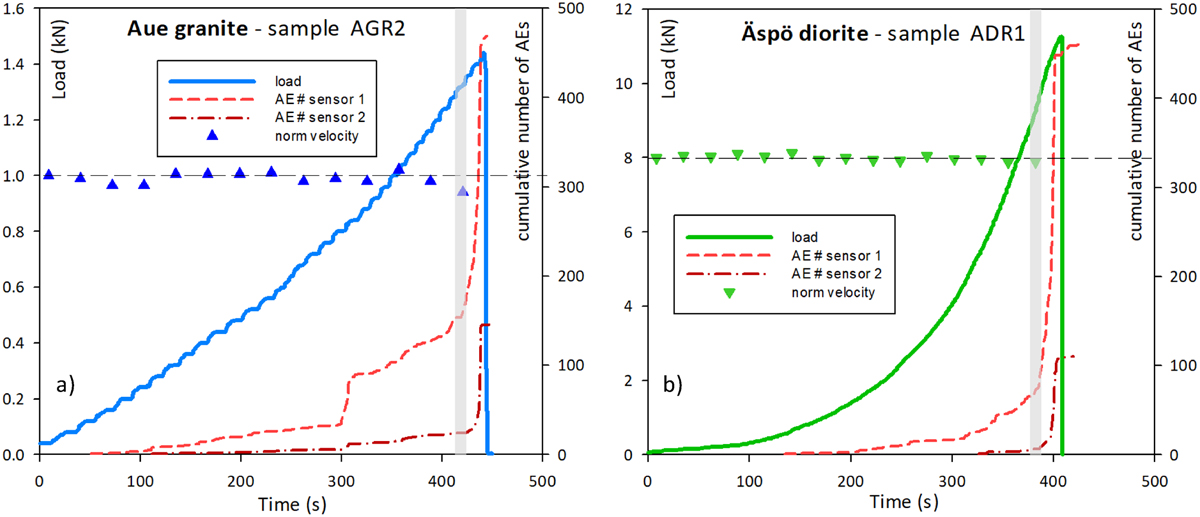
Fig. 4
Download original image
Example of loading curve, recording of acoustic emission activity and evolution of normalized P-wave velocity VP/VPo for selected samples (a) Aue granite sample AGR2 and (b) Äspö diorite sample ADR1. The horizontal dashed lines correspond to VP/VPo =1.
Exemple de courbe de chargement, d’enregistrement d’émissions acoustiques et d’évolution de la vitesse d’onde P normalisée VP/VPo pour des échantillons choisis (a) pour le granite d’Aue AGR2 et (b) pour la diorite d’Äspö ADR1. Les lignes horizontales en pointillés correspondent à VP/VPo =1.
Current usage metrics show cumulative count of Article Views (full-text article views including HTML views, PDF and ePub downloads, according to the available data) and Abstracts Views on Vision4Press platform.
Data correspond to usage on the plateform after 2015. The current usage metrics is available 48-96 hours after online publication and is updated daily on week days.
Initial download of the metrics may take a while.