")
")
Free Access
Fig. 31
Download original image
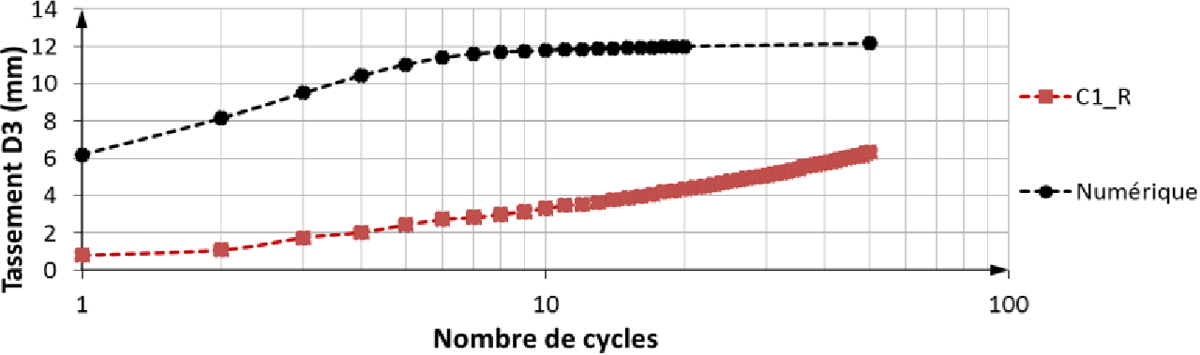
Évolution de l’accumulation de tassement numérique et expérimentale au pic des cycles en fonction du nombre de cycles pour l’essai C1_R.
Experimental and numerical evolution of the settlement D3 versus the number of cycles for the test C1_R.
Current usage metrics show cumulative count of Article Views (full-text article views including HTML views, PDF and ePub downloads, according to the available data) and Abstracts Views on Vision4Press platform.
Data correspond to usage on the plateform after 2015. The current usage metrics is available 48-96 hours after online publication and is updated daily on week days.
Initial download of the metrics may take a while.