")
")
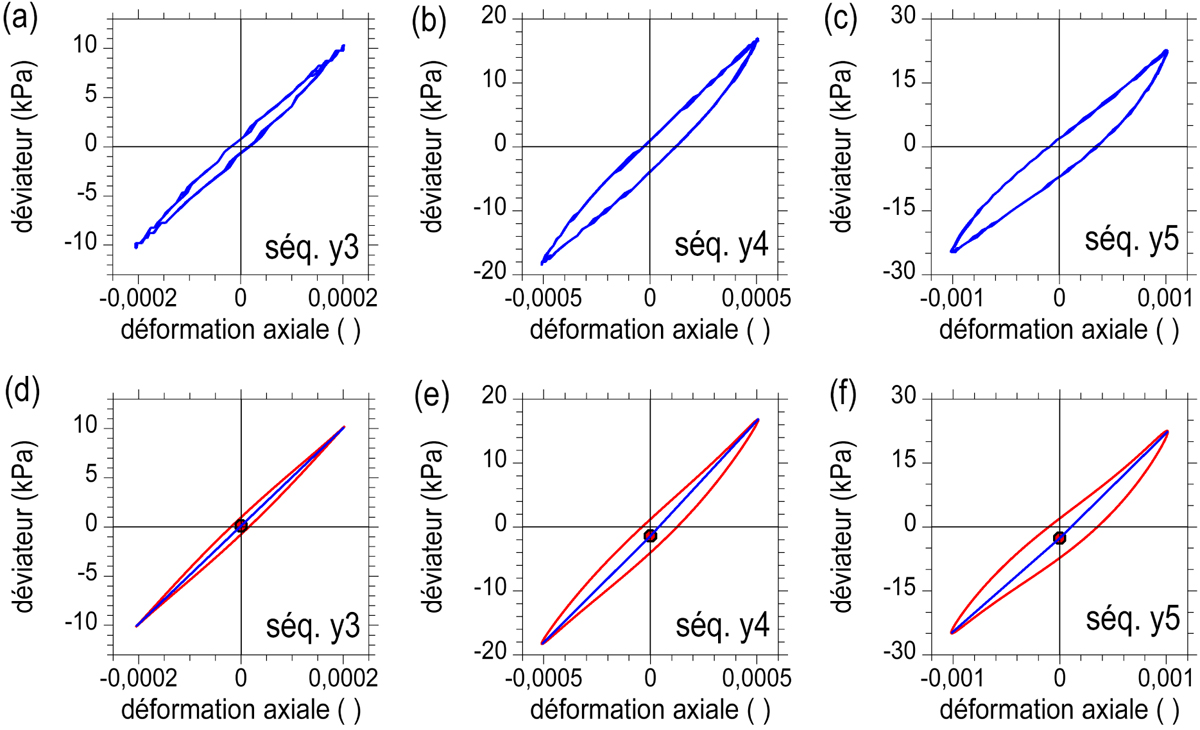
Fig. 7
Download original image
Courbes contrainte–déformation (εa q) enregistrées pendant les dix derniers cycles des séquences y3 à y5. a–c) Courbes expérimentales pour les amplitudes Δεa SA = 0,0002, 0,0005 et 0,001. d–f) Approximations correspondantes.
Stress-strain curves (εa q) recorded during the last 10 cycles of sequences y3 to y5. a–c) Experimental curves for amplitudes Δεa SA = 0,0002, 0,0005 et 0,001. d–f) Corresponding approximations.
Current usage metrics show cumulative count of Article Views (full-text article views including HTML views, PDF and ePub downloads, according to the available data) and Abstracts Views on Vision4Press platform.
Data correspond to usage on the plateform after 2015. The current usage metrics is available 48-96 hours after online publication and is updated daily on week days.
Initial download of the metrics may take a while.