")
")
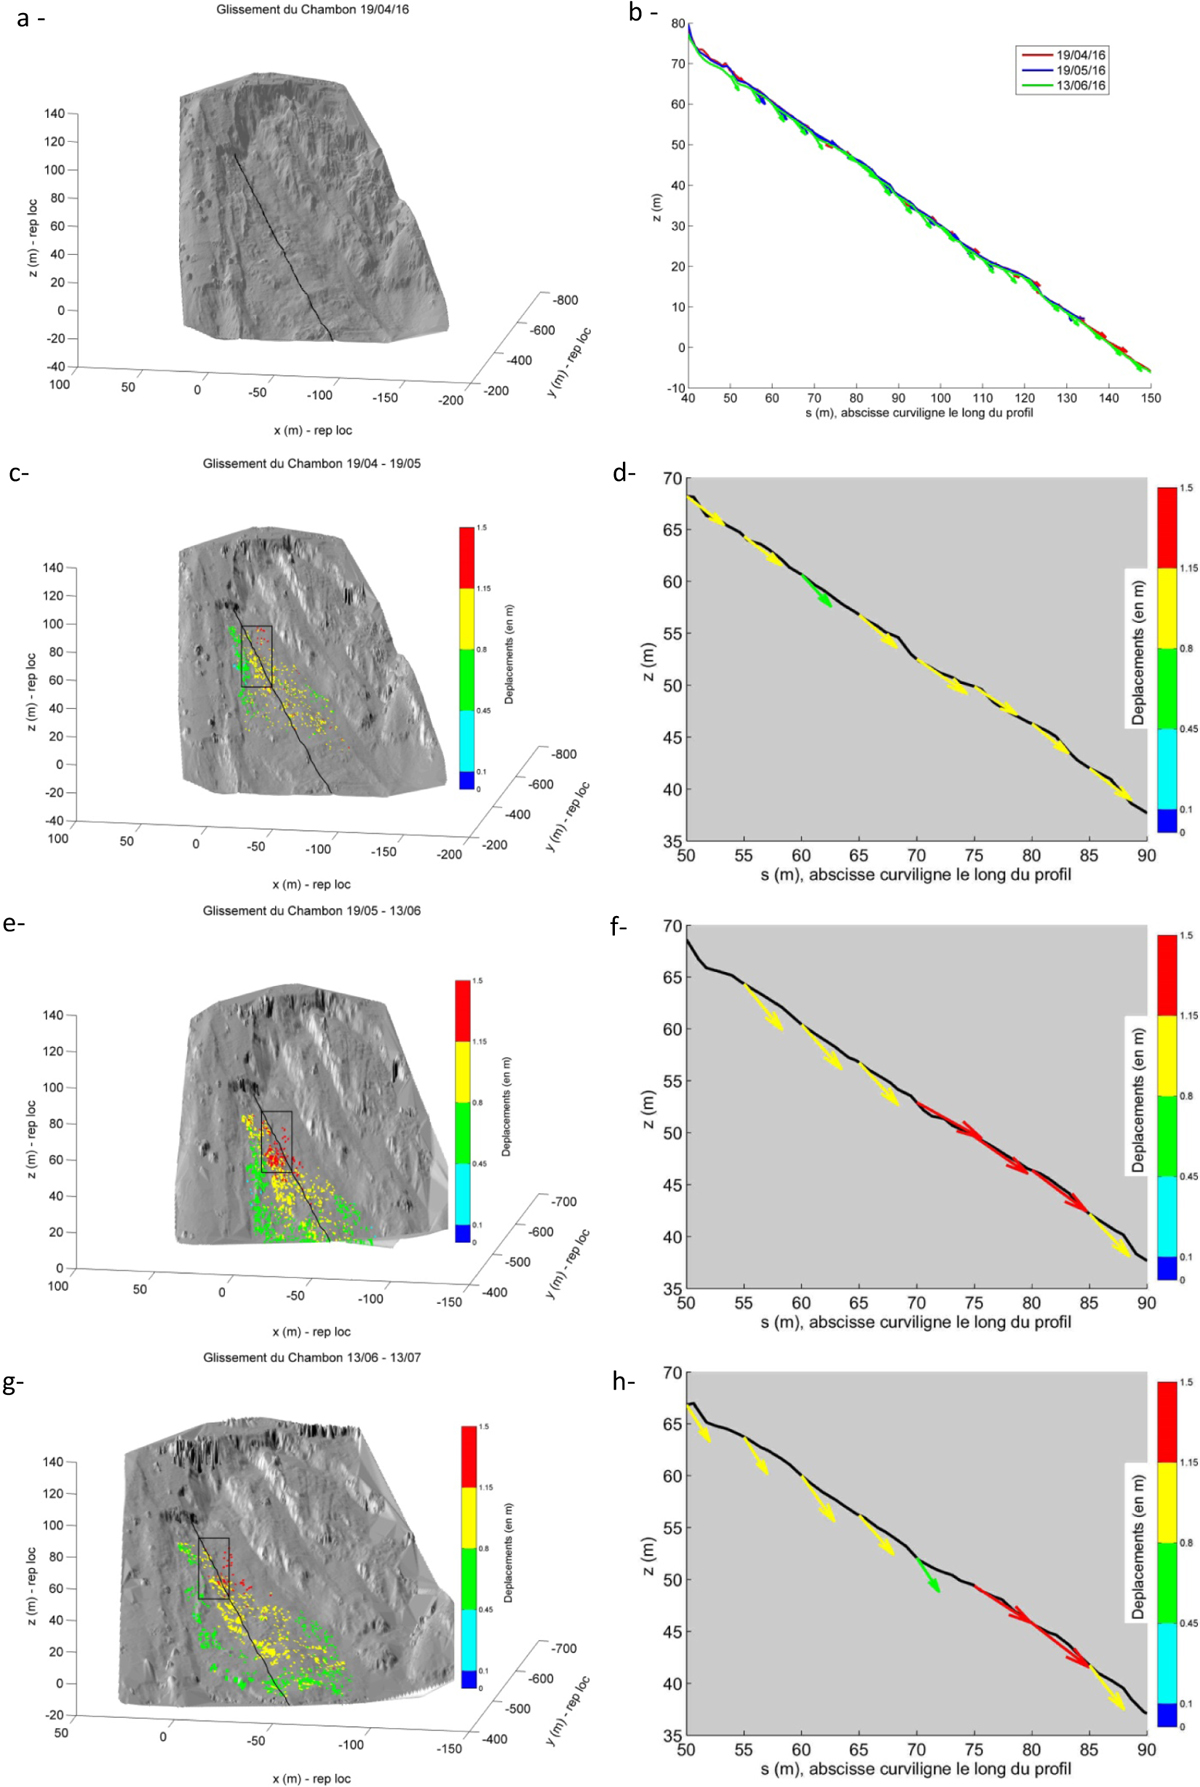
Fig. 13
Download original image
Profils des déplacements au niveau de la zone ZE1 : a − coupe réalisée, b − superposition des profils et des vecteurs directions des 19/04, 19/05 et 13/06, c, e et g : valeurs des déplacements représentées sur le MNT ombré les 19/04, 19/05 et 13/06, d, f et h : représentation des directions des déplacements sur une portion du profil (couleur de la flèche fonction de la valeur du déplacement) aux dates 19/04, 19/05 et 13/06.
Profiles of displacements of ZE1 zone : a − the cut, b − superposition of profiles and vectors directions of 19/04, 19/05 and 13/06, c, e and g: values of the displacements represented on the shaded DTM on 19/04, 19/05 and 13/06, d, f and h: representation of the directions of displacements on a portion of the profile (color of the arrow depending on the value of the displacement) on 19/04, 19/05 and 13/06.
Current usage metrics show cumulative count of Article Views (full-text article views including HTML views, PDF and ePub downloads, according to the available data) and Abstracts Views on Vision4Press platform.
Data correspond to usage on the plateform after 2015. The current usage metrics is available 48-96 hours after online publication and is updated daily on week days.
Initial download of the metrics may take a while.