")
")
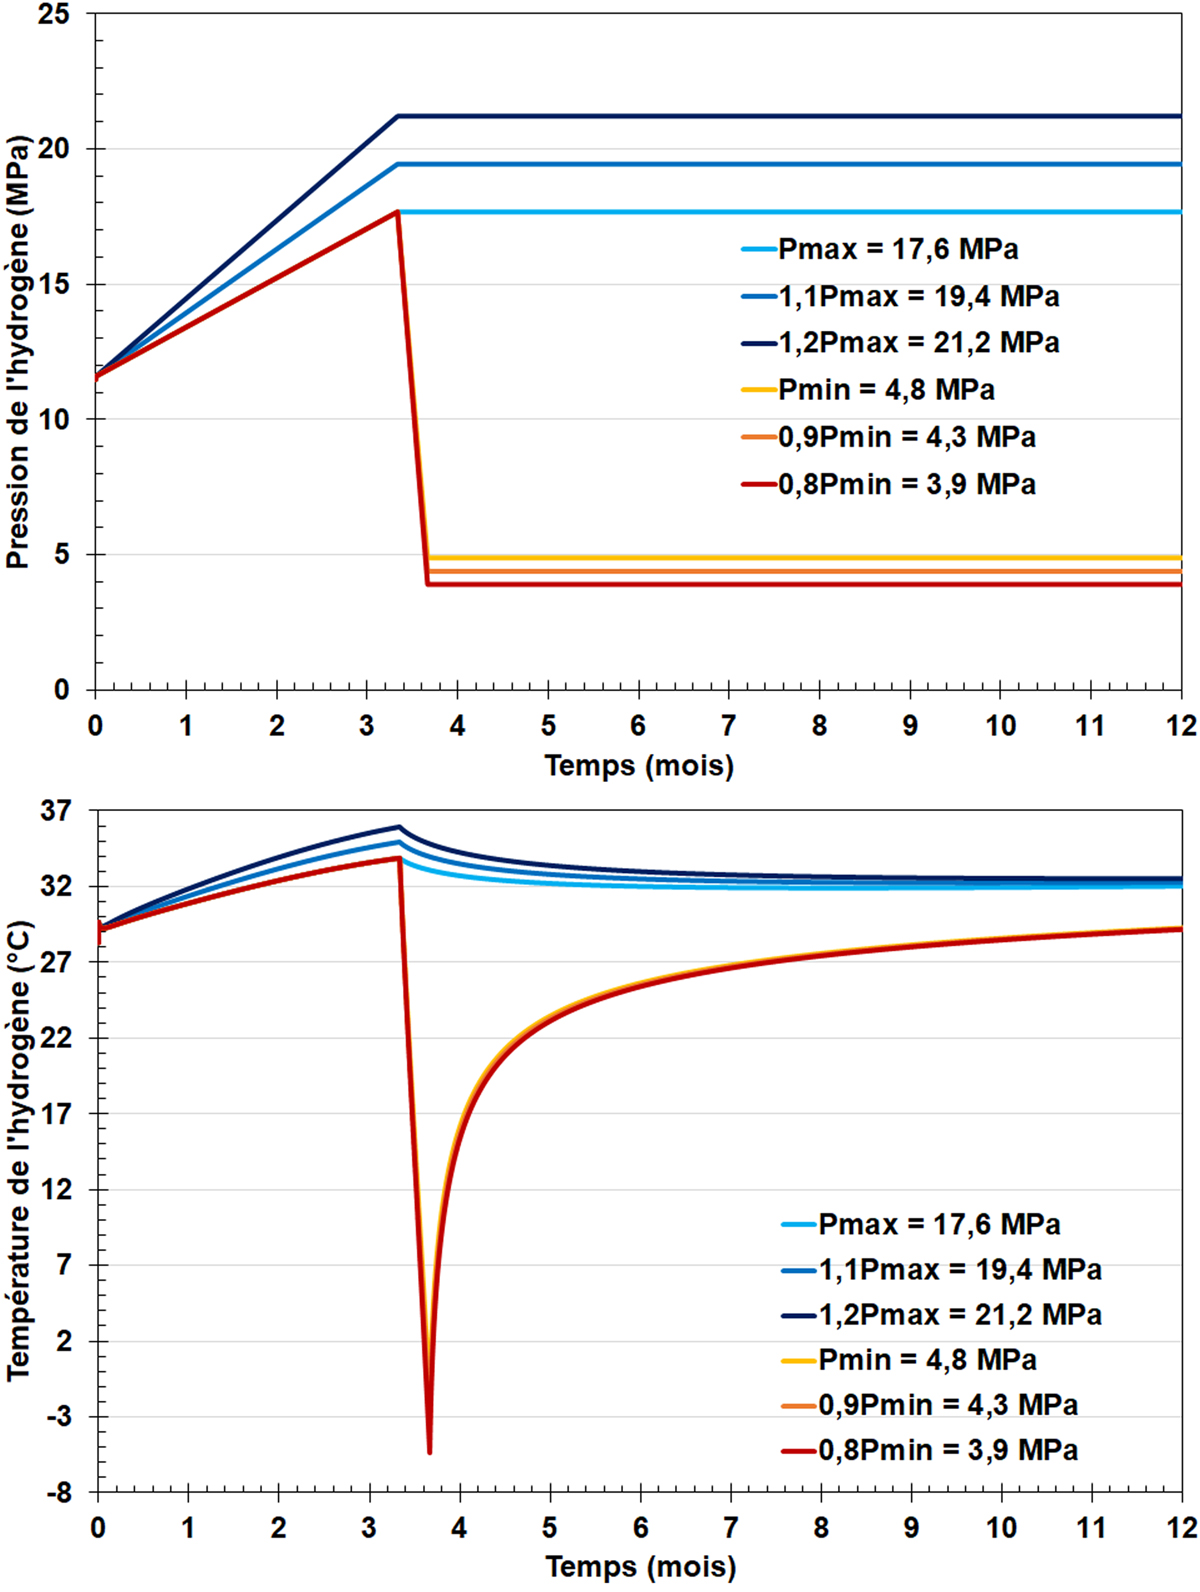
Fig. 6
Download original image
Évolution sur les 12 premiers mois de la pression (en haut) et de la température calculée (en bas) de l’hydrogène stocké dans la cavité saline ; dans cette figure, t = 0 correspond au début de la phase de remplissage.
Evolution over the first 12 months of the cavern pressure (top) and the computed cavern temperature (bottom) of the stored hydrogen in the salt cavern; in this figure, t = 0 corresponds to the beginning of the debrining.
Current usage metrics show cumulative count of Article Views (full-text article views including HTML views, PDF and ePub downloads, according to the available data) and Abstracts Views on Vision4Press platform.
Data correspond to usage on the plateform after 2015. The current usage metrics is available 48-96 hours after online publication and is updated daily on week days.
Initial download of the metrics may take a while.