")
")
Fig. 12
Download original image
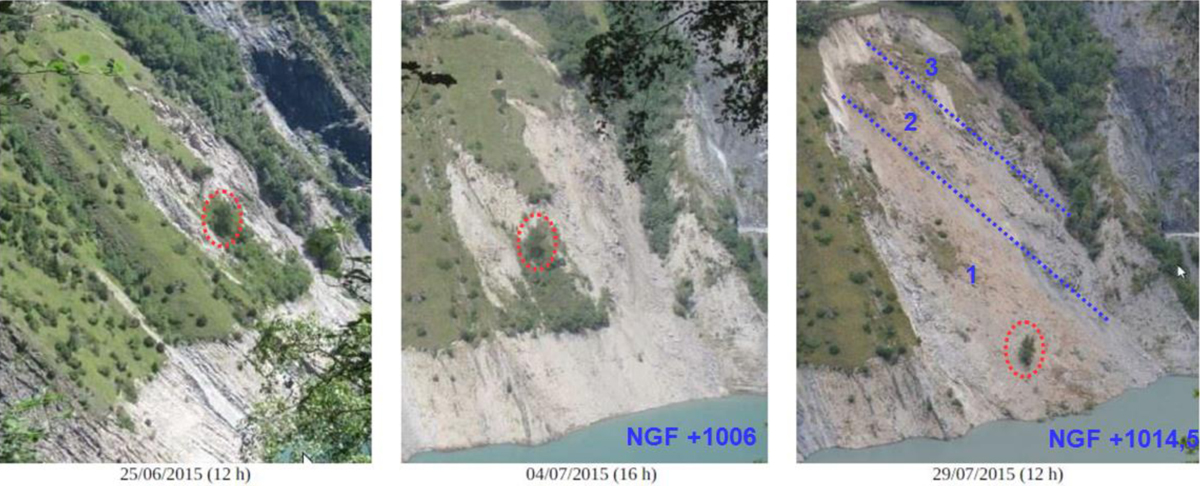
Différents stades d’évolution du glissement de terrain fin juin 2015 à gauche, début juillet 2015 au centre et fin juillet 2015 à droite (avec compartiments numérotés, arbre repère sur le glissement et cote NGF du niveau d’eau de la retenue).
Different stages of the landslide at end-June 2015 (left), early July 2015 (middle) and end-July 2015 (right) (with numbered compartments, landmark tree on the landslide and reservoir water level).
Current usage metrics show cumulative count of Article Views (full-text article views including HTML views, PDF and ePub downloads, according to the available data) and Abstracts Views on Vision4Press platform.
Data correspond to usage on the plateform after 2015. The current usage metrics is available 48-96 hours after online publication and is updated daily on week days.
Initial download of the metrics may take a while.