")
")
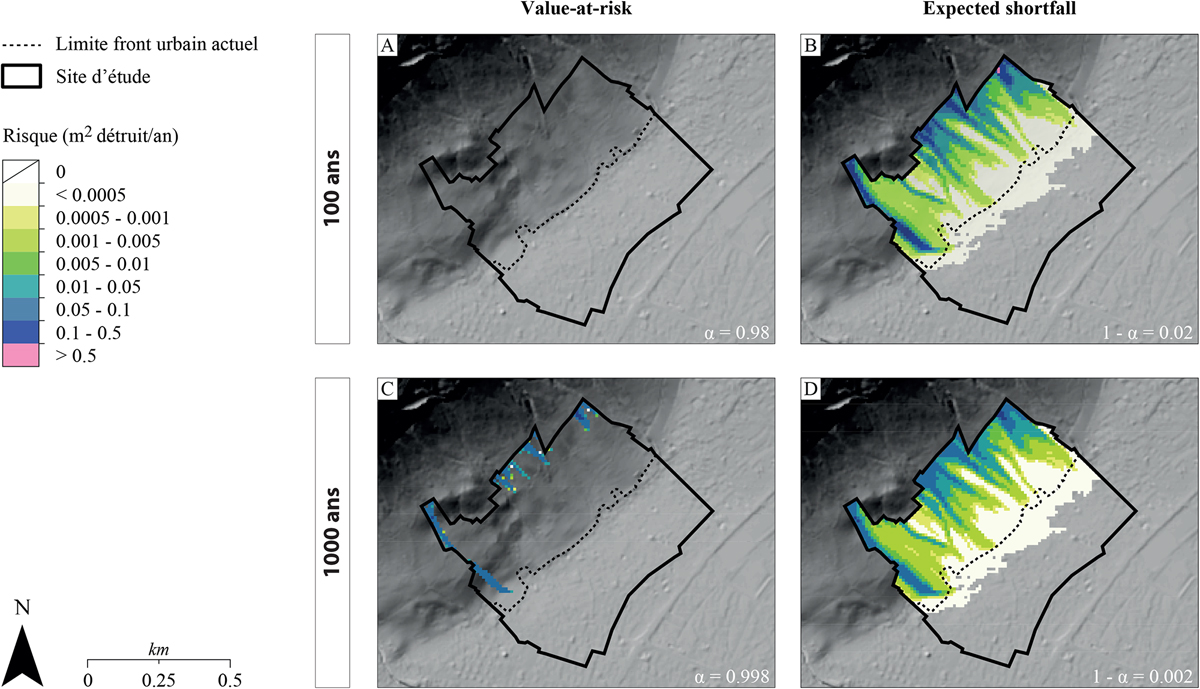
Fig. 6
Download original image
Cartographie du risque rocheux (en m2 détruits par an) dans un quartier de la municipalité de Crolles (Le Brocey) à partir de la value-at-risk (A, C) et de l’expected shortfall (B, D) pour des horizons t de 100 ans (A, B) et 1000 ans (C, D).
Map of the value-at-risk (A, C) and expected-shortfall (B, D) at Le Brocey and for temporal horizons t of 100 years (A, B) and 1000 years (C, D). Values are expressed in m2 destroyed per year.
Current usage metrics show cumulative count of Article Views (full-text article views including HTML views, PDF and ePub downloads, according to the available data) and Abstracts Views on Vision4Press platform.
Data correspond to usage on the plateform after 2015. The current usage metrics is available 48-96 hours after online publication and is updated daily on week days.
Initial download of the metrics may take a while.