Fig. 1.1

Download original image
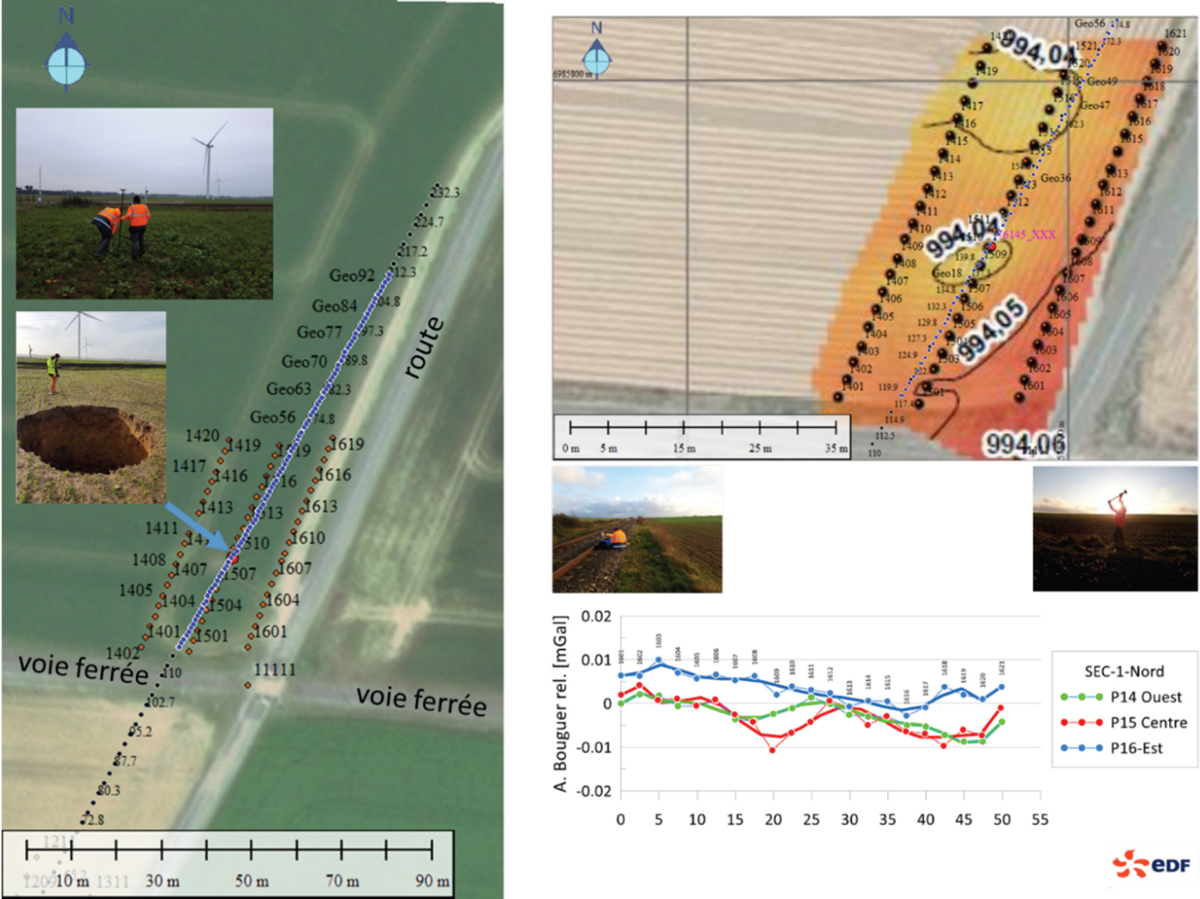
Localisation des profils géophysiques réalisés avec en noir le profil DCOS, en bleu le profil de sismique active et passive et en orange la microgravimétrie. Sur la droite figure la cartographie de l’anomalie de Bouguer et en bas l’anomalie résiduelle des trois profils.
Location of the geophysical profiles produced with the DCOS profile in black, the active and passive seismic profile in blue and the microgravity in orange. On the right is the cartography of the Bouguer anomaly and at the bottom the residual anomaly of the three profiles.
Current usage metrics show cumulative count of Article Views (full-text article views including HTML views, PDF and ePub downloads, according to the available data) and Abstracts Views on Vision4Press platform.
Data correspond to usage on the plateform after 2015. The current usage metrics is available 48-96 hours after online publication and is updated daily on week days.
Initial download of the metrics may take a while.


