")
")
| Issue |
Rev. Fr. Geotech.
Number 174, 2023
|
|
|---|---|---|
| Article Number | 4 | |
| Number of page(s) | 11 | |
| DOI | https://doi.org/10.1051/geotech/2023018 | |
| Published online | 25 October 2023 | |
Research Article
Analytical solution for expandable polyurethane grouting in a rock fracture
1
School of Water Conservancy and Transportation, Zhengzhou University, No. 100 Science Avenue, Zhengzhou 450001, China
2
Rockgro consulting, Beirut, Lebanon
* Corresponding author: This email address is being protected from spambots. You need JavaScript enabled to view it.
Abstract
Expandable polyurethane grout has been extensively utilized for the reinforcement and sealing of rock fractures. The diffusion mechanism of this grout is particularly unique, owing to the time-dependent characteristics of both its density and viscosity. However, the non-synchronous relationship between the change in diffusion radius and pressure poses challenges in deriving analytical solutions. In light of this, our study presents an innovative analytical model to effectively simulate the diffusion behavior of expandable polyurethane within rock fractures. Notably, this model considers both the self-expanding source and the convective driving force. The outcomes of our research demonstrate that spread and pressure exhibit distinct characteristic times, allowing us to employ the same equations with diverse parameters, yielding a semi-deterministic approach. In this approach, the first run of the model is deterministic while the second entails empirical considerations. Further, a comparison of analytical results with experimental injections was made involving varying grouting quantities, revealing excellent agreement between the measured and calculated pressures. The present model can be employed for fitting and real-time monitoring after calibration, enabling the exploration of conventional stop criteria, as well as refusal and mass criteria. Additionally, this model facilitates the formulation of conditions to effectively achieve the target, considering vital factors such as the time-spread relation, expansion ratio, and gel time.
Résumé
Le coulis de polyuréthane expansible est largement utilisé pour le renforcement et le scellement des fractures rocheuses. Le mécanisme de d’expansion est particulièrement unique comme la viscosité apparente et la densité dépendent du temps. Cependant, la relation non synchrone entre la propagation du polyuréthane et la pression pose des défis dans l’élaboration de solutions analytiques. Cette étude présente un modèle analytique innovant pour simuler efficacement le comportement de diffusion du polyuréthane expansible dans les fractures rocheuses. Notamment, ce modèle prend en compte à la fois la source auto-expansive et la force motrice convective. Les résultats de cette recherche démontrent que la propagation et la pression du polyuréthane présentent des temps caractéristiques distincts. Ceci permet d’utiliser les mêmes équations avec divers paramètres donnant lieu à une approche semidéterministe dans le sens que la première exécution est déterministe tandis que la seconde implique des considérations empiriques. De plus, une comparaison des prédictions analytiques avec des résultants d’injections expérimentales a été effectuée avec différentes quantités injectées révèlent un excellent accord entre les pressions mesurées et calculées. Le présent modèle peut être utilisé après calibrage pour le monitorage et la surveillance des injections en temps réel, l’exploration des critères de refus et d’arrêt conventionnels, ainsi que des critères de refus et de masse. De plus, ce modèle facilite la formulation de conditions permettant d’atteindre efficacement l’objectif, en tenant compte de facteurs essentiels tels que la relation de propagation dans le temps, le taux d’expansion et le temps de gel.
Mots clés : Expandable polyurethane / rock fracture / analytical model / pressure / target
Mots clés : polyuréthane expansible / fracture rocheuse / modèle analytique / pression / objectif
© CFMS-CFGI-CFMR-CFG, 2023
1 Introduction
Grouting plays a vital role in the sealing and reinforcing of fractured rock in various hydroelectric projects, including hydroelectric ventures, tunnel constructions and underground excavations. Diverse grouting materials, ranging from cement suspensions to chemical grouts, have been employed for treating fractured rock (Cambefort 1961; Funehag et al., 2018; Sögaard et al., 2018). Among these options, polyurethane, as a chemical grout, stands out for its remarkable impermeability and durability (Wei et al., 2017; Shi et al., 2011). According to Andersson et al.. (2001), polyurethane grouting has a proven track record of success where other grouts have failed.
First and foremost, polyurethane grouts can seamlessly combine with cement suspensions to effectively seal, reinforce, and stabilize rock masses, showcasing their prowess in penetrating thin fractures inaccessible to larger particle-sized cement suspensions. Additionally, expandable polyurethane demonstrates superior sealing properties compared to other grouting materials for water-bearing fractures with high water flow rate and pressure gradient. Furthermore, polyurethane proves adept in addressing large fractures and cavities, as its expansion properties under confined and pressurized conditions, enabling it to reach the nooks and crannies of the edges.
The design of rock grouting predominantly relies on analytical solutions, focusing on diverse slurry compositions, as well as injection pressure and flow rate, which serve as key governing factors (Zhang et al., 2018; Gustafson et al., 2013). Extensive research has delved into understanding the various driving mechanisms behind the flow of cement and sodium silicate grout within planar fracture, the plug flow region in Bingham radial flow solutions, and an analytical method for determining optimal stop criteria concerning grout spread and fracture deformation (El Tani and Stille 2017; Zhang. et al., 2018; Zou et al., 2020; Rafi et al., 2021). Drawing insights from these analytical tools, new developments have benefited decision-making in real time monitoring. The running limit is the real-time flow rate limit that is needed to stop grouting (EI Tani et al., 2020). Real Time Grouting Control (RTGC) is the real time version of Swedish grouting method (Gustafson et al., 2005; Stille et al., 2012). The aforementioned study mainly employs Bingham fluid model, which accounts for yield-stress behavior.
Over the past decades, there has been growing research on the diffusion characteristics of polyurethane grout within rock and soil. Fang et al. (2019) found a linear relationship between the maximum expansion force and the cured density of the grout. The final volume of the grout depends on the available space and the level of confinement it encounters (Buzzi 2008). In terms of numerical simulation, Guo et al. (2012) were pioneers in developing a numerical method, combining the finite volume method and volume of fluid approach, to model the diffusion of polyurethane grout within a slot. Building upon this, Hao et al. (2018) and Li et al. (2019) conducted further investigations into the diffusion behavior of polyurethane grout in a single fracture. These works revealed a three-stage process for polyurethane grouting: static pressure injection, expansion diffusion and cross-linking curing. During these stages, the driving action shifts from pumping pressure in the initial phase to self-expansion force in the subsequent stage. Notably, Li et al. (2021) experimentally disclosed the presence of hysteresis in pressure increase concerning the increasing diffusion radius. Subsequently, Liang et al. (2022) elucidated that this hysteresis effect in the pressure field arises from the time-varying feature of polyurethane grout viscosity. Additionally, researchers have delved into foaming expansion process in mold filling, considering both the chemical kinetics and fluid dynamics (Karimi et al., 2017; Rao et al., 2018). This process shares similarities to chemical kinetics, but diverges significantly in environmental conditions.
Despite the valuable insights gained from the research on the diffusion of polyurethane grout, the analytical solutions of rock grouting with this material remain a challenge due to its complex fluid properties and complicated geological conditions. The desired outcome of polyurethane grouting is to achieve the desired diffusion distance while ensuring that the pressure does not exceed the limit pressure, as is the case with non-expandable grouts. However, it is a crucial to recognize that the diffusion mechanism of polyurethaneg grout differs significantly from that of non-expandable grout. Bingham grout is propelled solely by pumping pressure, whereas expandable grout has a unique progression. Initially driven by pumping pressure, it subsequently relies on its own self-expansion force, which arises from the chemical reaction. As such, there is a need to develop realistic analytical tools to deterimine the appropriate cessation point for polyurethane grouting. Taking chemical kinetics into account would render it practically impossible to obtain an analytical solution. Additionally, the time lag in pressure further complicates the development of an analytical model for polyurethane grouting. Addressing these complexities remains an ongoing challenge for researchers in this field.
The objective of this study is to investigate analytical solutions for polyurethane grouting in a fracture and establish stop criteria. To achieve this, time-dependent density and viscosity models are utilized to calculate the spread and pressure of the grout. The reliability of the analytical solution is validated by comparisons with back analysis results from previous experiments, supported by statistical analysis. Furthermore, the stop criteria for expandable polyurethane grout are thoroughly discussed. By providing insights into the diffusion behavior and appropriate stop criteria, this research can significantly contribute to enhancing the efficiency and effectiveness of polyurethane grouting techniques in rock engineering and construction projects.
2 Material properties
Polyurethane grout is formed by mixing two components, referred to components A and B. Component A consists of polyester polyols and polyether polyols with −OH groups, along with catalysts, blowing agents and other additives. Component B comprises isocyanate and polyisocyanate, providing the crucial −NCO groups. These two components come together in chemical reactions, giving rise to the formation of polymers and gases, including carbon dioxide and vaporized physical blowing agent. These gases become encapsulated within the liquid mixture, manifesting as tiny closed-hole bubbles, which effectively contribute to an expansion phenomenon at the macroscopic level (Lu et al., 1994). Microscopically, the number and size of these closed bubbles increase, leading to a noticeable increase in grout volume and a corresponding decrease in grout density. The properties and characteristics of the polyurethane grout are fundamentally influenced by the specific components present in Components A and B.
2.1 Time-dependent density
The density of polyurethane grout changes with time, and various researchers have proposed different models to describe this relationship. Mitani and Hamada (2003) assumed a linear relationship between volume and time, leading to the density equation ρ = ρ0/(1+αt), where α represents the rate of expansion. Seo et al. (2003) utilized an exponential functional with a negative exponent, expressed by ρ = ρ0e−kt, with k denoting the rate of exponential decay of density. Furthermore, some researchers have postulated that the density is a function of pressure, conversion and temperature (Baser and Khakhar 1994; Geier et al., 2009). To facilitate analytic solutions and align with previous experiments for foam-free rising, the difference of the density to its final value in our study is assumed to follow a decaying exponential relationship with time, which serves as a pragmatic approximation to capture the density variation over time effectively.
 (1)
(1)
where ρ is the polyurethane density, ρc is the pre-exponential factor or the maximal expected density variation, t is time, tc is the characteristic time and ρf is the final density. This model assumes that foaming begins immediately after the grout is injected. Sometimes it may take a few seconds for the reaction to start. The initial density is equal to the sum of ρc and ρf before foaming time.
The characteristic time tc and the expected density change ρc define the expansion. A smaller characteristic time indicates a faster expansion, while a larger expected density change leads to a higher expansion ratio. Non-expandable polyurethane has a small expected density change and a large characteristic time. To achieve full expansion, the gel time must be longer than the characteristic time, ensuring sufficient time for the expansion process to take place completely.
2.2 Time-dependent viscosity
The viscosity of polyurethane grout remains low before reaching the gel point, after which it increases rapidly until solidification. The initial viscosity of polyurethane grout can be adjusted within a wide range, typically ranging from 10mPa · s to 1 Pa · s. The evolution of viscosity is attributed to the generation of carbon dioxide and the kinetics of polymerization (Bikard et al., 2007). Various viscosity models are present in the literatures, including constant viscosity, time-dependent models, Castro–Macosko model and Bird–Carreau model. The constant viscosity model tends to overestimate the foam rise. The Castro–Macosko model and Bird–Carreau model both describe viscosity as function of temperature, gas content and curing reaction, introducing complexity and impeding the derivation of analytic solutions. To address this, a time-dependent viscosity model (Eq. (2)) was employed, which takes into account the experimental findings and provides a more suitable representation of the grout’s rheological behavior (Hao et al., 2021).
 (2)
(2)
where A1, t1 and µ0 are fitting parameters, which can be obtained by fitting the experimental data for viscosity.
3 Analytical solutions of polyurethane grouting in a fracture
Figure 1 illustrates the diffusion process of injecting polyurethane into a hard rock fracture. The fracture is represented as a thin disc with an average aperture of 2H. The fracture wall is considered rigid and does not deform during the injection. Polyurethane grout is injected into the fracture through a grouting hole with a radius of a. At any given time, the maximum diffusion radius is denoted as b. The spread refers to the distance from the front of the injected grout to the edge of the injection hole. The effective pressure P is the difference between the entry pressure P(a,t) and the front pressure p(b,t). The radial coordinate is denoted as r and the axial coordinate z.
Given that the fracture aperture is significantly smaller than the position of the front, a lubrication frame assumption with self-expansion and convection is made due to the prevailing influence of viscous forces over inertia forces. It is assumed that the expansion rate, density and viscosity are uniform and predictable, implying that their time dependence is already known or preestablished. The expansion rate, denoted as S, is characterized as the reciprocal of the density rate with respect to the density ρ, expressed as
 (3)
(3)
The radial flow of an adhering foam to the plates obeys the principles of mass and momentum conservation. The mass balance equation of a radial flow with time-dependent density can be written as
 (4)
(4)
in which z is the axial coordinate, and u and w are the radial and axial velocities respectively. Integrating over z and considering adherence, at the upper and lower plates, that is w = 0 at z = ±H, equation (4) is rewritten as
 (5)
(5)
in which ū the mean radial velocity or
 (6)
(6)
The mass M of the mix in the fracture is
 (7)
(7)
The mass is also the sum of the initial mass and the injected quantity
 (8)
(8)
in which M0 is the initial mass or mass at t = 0 and Q(a, t) is the volumetric rate at the entry of the fracture.
The volumetric flow rate can be expressed as
 (9)
(9)
In the frame of the lubrication model, the momentum equation for the zero-order expansion of the variables and first-order truncation of the equations is
 (10)
(10)
Integrating over the vertical axis gives
 (11)
(11)
Substituting equation (11) into equation (6) yields
 (12)
(12)
The solution of the equations give the pressure p(r,t) and the front coordinate location b(t) that depend on the initial and boundary conditions. The boundary condition for a flow rate control Qa at the entry and constant pressure at the front is written as
 (13)
(13)
 (14)
(14)
in which Qa is constant or slowly varying. This does not imply a constant flow rate or a slowly varying one in the fracture because of the expansion. According to equation (13), The average entry velocity, ua, is
 (15)
(15)
Integrating equation (5) over the radial coordinate and substituting equation (15) gives
 (16)
(16)
Inserting equation (16) into equation (12) and integrating over the radial coordinate, the effective pressure equation is obtained and is
 (17)
(17)
The front of the diffusing material is obtained from equations (7) and (8):
 (18)
(18)
Equations (17) and (18) are the main relations that are used to calculate the pressure in the mix and its spread respectively. These equations are also valid for a non-expandable polyurethane for which the expansion rate S is zero.
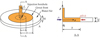 |
Fig. 1 Schematic diagram of polyurethane grouting with a radial flow. |
4 Verification and analysis
The present analytical solution is validated through a comparison with the experimental results obtained by Hao et al. (2018). In the experiment, a specified quantity of two-component polyurethane foam grout was injected by into a visualized 1.6 m × 1.2 m × 6 mm parallel plate fracture using an integrated multifunctional grouting system. Given the relatively small quantity of grout used, the spread direction can be reasonably approximated as infinite. A grouting hole with a radius of 8 mm was positioned at the center of upper fracture wall. Throughout the experiment, the diffusion process and pressure were monitored in real time by a camera and pressure sensors. In this study, the entry flow is assumed to be constant, and the fracture model and grouting quantity adopts the same values as those used in the lab experiments. The essential parameters of the viscosity, density, fracture properties and entry flow rate are all presented in Table 1.
Parameters for polyurethane grouting process.
4.1 Spread and front location
The analysis involves the evaluation of the front change during an injection lasting three seconds, which subsequently expanded for about a minute. The total mass of the injected polyurethane amounts to 0.48 kg. The comparison of calculated and measured spreads at the front is shown in Figure 2. The investigation comprises two different initial conditions, each pertaining to distinct injection procedures. In the first case, the injection commences with no initial mass (M0 = 0) and spans three seconds, with an injection rate of ρQa = 0.16 kg/s for 0 ≤ t <3 s. Following this, the mass reaches 0.48 kg, and the injection ceases with Qa = 0 for t ≥ 3 s. In the second case, there is an initial mass (M0 = 0.48 kg) with no injection, and the expansion initiates accordingly with Qa = 0. The results reveals that both curves merge after the injection period. Notably, injections of a given mass with varying injection rates follow the same path after the cessation of the injections. This phenomenon can be attributed to the assumption that the expansion is reproducible. The volume of a given mass at any time is determined by the mass-to-density ratio and remains unaffected by the injection mode. According to Wang (2020) the density of polyurethane grout in the fracture surpasses that of free rise. The fitting parameters of the density yield a final density of ρf = 180 kg/m3, an initial density of 1178 kg/m3 and a characteristic time tc = 5 s. The ratio of the final density to the initial density indicates a 6.5 times increase in the initial volume.
Figure 2 shows excellent agreement between the measured and predicted front locations irrespective of of the injection procedure. A comparison of the expansion parameters for the density of the injection and those of a free-rise test is presented in Table 2. The expansion ratio of the free rise test stands at 20 while the injection’s expansion ratio records 6.5, signifying that the free rise test shows three times the expansion of the injection. Remarkably, the characteristic times remain unaltered and continue to be equal to 5 s in both cases. This observation underscores the significance of meeting specific conditions to achieve a reproducible polyurethane expansion. The root cause of the expansion discrepancy is elucidated by Niedziela et al. (2019) who conducted experiments on free rise in tubes with different diameters. They attributed the variation in the expansion ratio to differences in the thermal behavior and rheological properties of the material. The diverse tube diameters generated different thermal effects, impacting the viscosity and overall expansion. Although the tube geometry is not explicitly listed as a parameter influencing expansion change, it implicitly responds to varying thermal behaviors. Nevertheless, it is assumed in this study that the requisite conditions are met, fostering a reproducible expansion process.
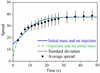 |
Fig. 2 Measured and calculated spreads at the front. |
Parameters for polyurethane density.
4.2 Pressure Distribution
Figure 3 shows the comparison results of pressure variation over time at different radial distances. Figure 4 presents the comparison of the calculated pressure with the measured pressure at different radius positions and time intervals. The triangle and circle symbols represent two sets of experimental data in different radial directions. It is evident that the calculated pressure agreed well with the experimental results, indicating the precise description of present analytical model for the temporal and spatial pressure distribution. Moreover, the model aptly captures the delayed increase in pressure at locations away from the grouting hole, further enhancing its accuracy in describing complex pressure behavior.
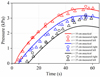 |
Fig. 3 Comparison of pressure between analytical and experimental results. |
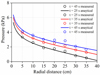 |
Fig. 4 Comparison of pressure variations over time between analytical and experimental results. |
4.3 Goodness of fit
A linear regression analysis of the calculated and the experimental pressure was conducted, as shown in Figure 5. The horizontal axis represents the calculated pressure and the vertical one the measured values. If the measured and calculated pressures were equal, they should stay on the solid line that makes a 45°angle with the horizontal axis. In fact, we obtained a fitted dotted line with a slope of 43.4°, which indicates that the calculated pressure is in good agreement with the measured values. It should be noted that the calculated pressure deviates to larger values with some probability because of the assumptions of no slip condition. However, the overall reliable results encourage more investigation into the difference between the measured and calculated pressure. The difference would be a random variable with a normal distribution if the prediction left nothing behind.
The mean value of the difference between the measured and calculated pressures is μ = −0.117 kPa, the standard deviation σ = 0.195 kPa and the corrected or unbiased standard deviation s = 0.197 kPa. The latter is obtained in a similar way to the standard deviation by dividing the variance by N-1 instead of the number of data points. There are 36 data points. For practical reasons, the data are shifted through the mean value to centre them. The centred data have a zero mean value with an unchanged standard deviation and unbiased deviation. The centred data are plotted in Figure 6.
The vertical axis in Figure 6 is divided into intervals of 0.2 kPa. This leads to six consecutive intervals that cover the entire data set that is bounded by −0.6 and 0.6 kPa. Table 3 shows the alignment of the points in the six intervals and the expected count considering a normal distribution with an unbiased standard deviation. The histogram of the expected counts and the normal distribution is plotted in Figure 7. The correspondence between the histogram and the Gauss distribution is visually perfect, but remains to be confirmed statistically.
The test hypothesis was used to confirm or reject the goodness of fit. The hypothesis that needs to be rejected is the null hypothesis that is noted H0. The null hypothesis H0 is: the data repartition of the pressure difference follows a normal distribution. If the null hypothesis is rejected, an alternative hypothesis Ha will prevail that is the data repartition does not follow a normal distribution. Many statistical methods are available for decision making such as the chi-squared test and normality tests that have been developed for this purpose. The Pearson chi-squared test is used because it can be done manually using a calculator. In Pearson tests, an estimation of χ2 is used, which is the squared difference between the observed data and the expected data divided by the expected data. A validity condition needs to be satisfied when using the Pearson relation: 80% of the expected values should be greater or equal to five which is Cochran’s condition according to Steele (2003). The expected values for the first and sixth intervals in Table 1 are below five. The second and fifth intervals also contain expected counts that are less than five. To satisfy Cochran’s condition, the first and second intervals are merged as well as the fifth and the sixth intervals. The number of intervals decreases to four. The expected counts in the merged intervals 1–2 and 5–6 are both equal to 5.5945, which is greater than five. The Pearson χ2 estimation may now be safely used and is
 (19)
(19)
where Oi and Ei are the observed and expected data in the ith pre-merged intervals. The estimated value of χ 2 is 0.751. The decision-making is never warranted 100% but generally accepted when the level of significance of the risk of error is less than 5%. The critical value of χc2 is retrieved from the theoretical chi-square distribution that depends on the number of degrees of freedom and the level of significance. The level of significance is set to 5% and the degree of freedom is the number of intervals less 1 minus the number of free parameters. The current degree of freedom is df = 1 which is four the number of intervals less one minus the two free parameters that are the mean value and the standard deviation. The corresponding critical value with df = 1 and α = 0.05 is χc2 = 3.84 which is taken from the table of the χ2 distribution; α is the significance level.
Pearson estimation χ 2 = 0.751 is less than the critical value χ c2 = 3.84, which means that it is not possible to reject the null hypothesis. Hence, the repartition of the pressure difference follows a normal distribution confirming that the analytic model captured the essence of the measured pressure.
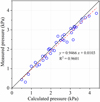 |
Fig. 5 Regression analysis of the calculated and the measured pressures. |
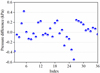 |
Fig. 6 Difference between the measured and calculated pressure. |
Distribution of the observed and expected number of points in the intervals.
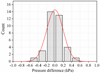 |
Fig. 7 Histogram and normal distribution. |
5 Pressure control
The analytic solution that was presented in section 3 is based on two driving forces self-expansion and an entry flow rate. The operator may have to inject polyurethane grout with a predefined pressure. In this case, the analytical solution takes a different form. It is obtained directly from the governing equations with different boundary conditions. The entry pressure is p(a,t). It exceeds the front pressure p(b,t) and their difference is noted P. The pressure in the injected mix becomes
 (20)
(20)
The front location is obtained from the following integral equation:
 (21)
(21)
6 Stop criteria
Polyurethane grout has found extensive application in sealing and reinforcing tunnel and dam projects (Andersson et al., 2001; Naudts 2003; De Marco 2008; and Rana et al., 2016). In order to ensure successful grouting outcomes and efficient implementation, the stop criteria and mass criterion have been prominently discussed. These criteria play a crucial role in guiding the selection of appropriate grouting design parameters and optimizing the usage of grouting materials, leading to cost-effective solutions (Du et al., 2021).
The stop criteria, also referred to as the minimal flow criterion, is widely used for grouting non-expandable grouting materials. It determines when the injection should be stopped based on a flow rate limit corresponding to the desired target. El Tani and Lopez–Molina (2020) updated the stop criteria for non-expandable materials, enabling the prediction of the flow rate limit based on target specifications and grouting model assumptions. However, this approach is not applicable to expandable polyurethane grout due to its unique self-expanding nature, rendering the injection rate an unreliable indicator for reaching the target. Polyurethane grout continues to expand even after the injection is stopped, reaching its pressure during curing time. Thus, a revised stop criteria is essential, taking into account factors such as the injected mass, expansion rate, and gel time to effectively determine when the desired target is achieved..
The second criterion used in grouting is the mass criterion, specifically applicable to expandable polyurethane material. Unlike non-expandable materials, where a volume criterion is often employed despite not fully satisfying a conservation law, the mass criterion for expandable materials aligns with the balance law. This choice is justified by the fact that volume and mass can be interchangeably used when the grout density remains nearly constant. However, for expandable polyurethane grout, the density is not constant, and as a result, the mass criterion becomes more appropriate for ensuring accurate and reliable grouting outcomes.
The implementation of refusal and mass criteria require preliminary investigations of the rock mass, accomplished through geological, hydrogeological, or rock mechanics surveys. A geological survey that focuses on fractures is essential for determining the appropriate stop criteria and defining the target. For intact fractured rocks, the target is often defined as a specified spread, especially for persistent fractures intersecting the injection holes. In densely fractured rock formations, the target is typically expressed as a volume that needs to be filled. For stage grouting, evaluating the volume to be filled is crucial to determine the required grout mass, considering the appropriate expansion ratio and gel time. Regardless of whether the refusal or mass criterion is used, the target must be defined as the distance intended for the grout to reach from the injection hole. In the case of tunelling grout fans or dam grout curtains, the target distance is generally set to be greater than the mid-distance between consecutive injection holes, ensuring the creation of a continuous sealing barrier, as depicted in Figure 8. If the distance between injection holes is denoted as 2d, then the target distance D will be greater than d (D > d).
In the case of rock mass with a discrete set of fractures, the volume to be filled in a single fracture should satisfy the condition
 (22)
(22)
in which D is the target and tG is the gel time. equation (22) means that the spread must attain or exceed the target before the gel time for successful injection. The spread will be calculated with equation (18) or equation (21) depending on the external driving action which can be an injection rate or an injection pressure. The mass that will be injected in a single fracture is
 (23)
(23)
The time at which the injection condition will be fulfilled can be achieved by inversely solving equation (18) or equation (21). This setp is important as it ensures that the target distance is reached before the gel time is attained. Additionally, it is essential to consider the mixing process, including the induction time, gel time, and cure time, which are influenced by the specific batch recipe and preparation method. The designer can strategically plan these factors to meet the injection condition requirments. Moreover, The mixing process plays a vital role in determining the consistency and the final expansion of the polyurethane grout. Adherence to predefined criteria for performance and durability during both construction and operational phases of the project is crucial in achieving the desired results and ensuring the long-term effectiveness of the grouting application.
A hydrogeological survey that specifically focuses on water-bearing fractures and flowing water is essential to determine if the injection will occur against hydrostatic pressure or flowing water. In scenarios where grouting is conducted in a flowing water regime, the self-expansion of polyurethane must be complemented by an injection pressure. The designer choose the pumping pressure and flow rate for a successful implementation of the selected stop criterion. It is imperative to be mindful that polyurethane intereacts with water during the grouting process, and its reaction can vary depending on its hydrophilic or hydrophobic properties. This variability can affect the programmed behavior of the polyurethane grout, resulting in parts that may start foaming while others are already solidifying or have not reacted at all.
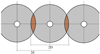 |
Fig. 8 A planar view of a continuous barrier with a target D that exceeds the mid-distance d between the injection holes. |
7 Discussion
The analytical solution presented in this study showcases remarkable accuracy and finds applications in making predictions under specific injection conditons, which is conform to the framework encompassing lubrication assumptions, self-expansion, and convection. A key aspect to recognize is the clear differentiation between the proposed mechanical solution and the thermochemical process associated with the blowing reaction. The present model is purely mechanical, without any thermodynamic or chemical reactions.
The calculated pressure profiles show a commendable agreement with the experimental results, largely attributed to the skillful incorporation of supplementary boundary conditions. By accounting for an artificial flow rate, where none existed, and by introducing expansion rates, an extra driving force is generated. In this way, the model effectively compensates for the neglected thermochemical effects. Remarkably, despite these adjustments, the analytical solution accurately reproduces the measured pressures at different distances from the injection hole at different times.
The analytical method is mathematically accurate, but requires different parameters due to its omission of the thermo-chemical process. This dynamic reaction generates gas and heat, leading to bubbling, increased pressure, and material expansion. Interestingly, the reaction continues even after the observed expansion, as confirmed by recent studies (Li et al., 2021). Consequently, to ensure accurate pressure calculations, complementary characteristic times and additional entry flow rates need to be considered. The model adeptly accommodates experimental spread and pressure data through the incorporation of diverse characteristic times and entry flow rates. As displayed in Table 2, the characteristic time for the actual spread stands at 5 s, while the entry flow rate reduce to zero after the injection period. Notably, pressure calculation entail the use of an 18 s the characteristic time and a 4.4 lt/min entry flow rate. In essence, the present model comprises three distinct equations. Specifically, equation (18) is employed to calculate the spread and grout front, while equation (17) is used for the calculation of pressure values. However, it is important to highlight that equation (18) is employed twice, each time with differing flow rates and characteristic times. In the second step, it aptly embodies an empirical expansion process designed to compensate for the previously omitted thermo-chemical reaction.
Indeed, a model capable of simultaneously capturing the spread and pressure dynamics with a unified set of parameters, without the need for additional conditions, holds immense appeal. Such an ideal model would undoubtedly embrace the intrinsic significance of the thermo-chemical reaction. It would encompass an extensive set of governing equations, meticulously accounting for the mass, momentum, energy, and entropy balance of each individual component within the mixture, as well as their intricate interactions (El Tani, 2013). However, it is important to recognize that achieving this level of comprehensiveness may preclude the development of a simple analytical model.
8 Conclusions
A new analytical model for polyurethane grouting, incorporating time-dependent density and viscosity, is presented. The model was validated using the experimental data from rock fracture grouting and the results were statistically analyzed through regression analysis and Pearson chi-squared test. The analysis showed that the proposed analytical model accurately captures the essence of the measured data, representing a significant improvement in the calculation of polyurethane grout.
The presented model considers self-expansion and an additional convection term, but does not take into account the thermo-mechanical blowing reaction. Although the model provides an exact solution, it should be regarded as a fitting model rather than a predictive one, owing to its physical approximation of polyurethane expansion. Nonetheless, the insights gained from this model are invaluable for understanding the behavior of polyurethane injections. Notably, injections with different rates follow the consistent temporal path after the end of the injection period, which holds significant practical implications.
The criteria for determining the endpoint of expandable polyurethane injections were discussed. The traditional stop criteria, commonly used for non-expandable mixtures, may not be suitable for expandable grouts. This is because expandable grouts can expand by themselves without external forces. Therefore, the stop criteria should be modified to consider the mass rate. On the other hand, the mass criterion is well-suited for expandable polyurethane and requires thorough preliminary- investigation of hydrogeological and rock mechanics to determine the volume to be filled and prepare a mix with the appropriate mass, expansion rate, ratio, and gel time. Such considerations are crucial for successful polyurethane grouting applications.
Acknowledgements
M. Hao, and Xiaolong Li acknowledge the support by the National Natural Science Foundation of China (Grant Nos. 51908514, 52178401). Xiaolong Li also acknowledge the support by Science and Technology Innovation Team Support Program for Henan Universities [Grant No. 23ITTSTHN014], Central Plains Talent Program in China (Grant No. 234200510014).
M. El Tani is not concerned by the above-mentioned support and grants and has not received any funding from it.
Notations
a: radius of the injection hole
b: spread, advance, front location, diffusion
d: mid-distance between the injection hole
D: Target or required spread from the injection hole
df: degree of freedom
Ei: expected count
H: half-thickness of the fracture
Q: volumetric flow rate
Qa: entry volumetric rate
M: mass of polyurethane in the fracture
M0: initial mass or mass at time zero
Oi: observed count
p: effective pressure or difference of the pressure to in situ pressure
P: effective injection pressure
r: radial coordinate
S: expansion rate
t: time
tG: gel time
u: radial velocity
--ū: mean radial velocity
ua: mean velocity at the entry of the fracture
w: axial velocity
z: axial coordinate
α: significance level
ρ: density
μ: dynamic viscosity
τ: integration dummy
χc2: critical chi squared for given α and df
χ 2: chi squared
π: pi number
References
- Andersson HMK, Borchardt PJ, Bruce DA. 2001. The use of polyurethane resins in tunnel grouting, Rapid excavation and tunneling conference, San Diego, CA, June 11-11, 18 pp. [Google Scholar]
- Baser SA, Khakhar DV. 1994. Modeling of the dynamics of water and R-11 blown polyurethane foam formation. Polym Eng Sci 34: 642–649. [CrossRef] [Google Scholar]
- Buzzi O, Fityus S, Sasaki Y, Sloan S. 2008. Structure and properties of expanding polyurethane foam in the context of foundation remediation in expansive soil. Mech Mater 40: 1012–1021. [CrossRef] [Google Scholar]
- Bikard J, Bruchon J, Coupez T, Silva L. 2007. Numerical simulation of 3D polyurethane expansion during manufacturing process. Colloids Surf A: Physicochem Eng Asp 309: 49–63. [CrossRef] [Google Scholar]
- Cambefort H. 1961. L’injection et ses problèmes. Bull Tech Suisse Romand 87: 329–341. [Google Scholar]
- De Marco MJ. 2008. Polyurethane resin (PUR) injection for rock mass and structure stabilization, 6th Int. Conf. Case Histories in Geotechnical Engineering, Arlington, 12p. [Google Scholar]
- Du X, Fang H, Wang S, Xue B, Wang F. 2021. Experimental and practical investigation of the sealing efficiency of cement grouting in tortuous fractures with flowing water. Tunnel Undergr Space Technol 108: 103693. [CrossRef] [Google Scholar]
- El Tani M, Lopez-Molina J. 2020. Running limit and refusal in rock fractures grouting. Rock Mech Rock Eng 53: 2201–2214. [CrossRef] [Google Scholar]
- El Tani M, Stille H. 2017. Grout spread and injection period of silica solution and cement mix in rock fractures. Rock Mech Rock Eng 50: 2365–2380. [CrossRef] [Google Scholar]
- El Tani M. 2013. Challenges in poroelasticity and solid-fluid mixtures development, 5th Biot Conference, Wien, ASCE, 1; 2441–2450. [Google Scholar]
- Fang H, Su Y, Du X, Wang F, Li B. 2019. Experimental and numerical investigation on repairing effect of polymer grouting for settlement of high-speed railway unballasted track. Appl Sci 9: 4496. [CrossRef] [Google Scholar]
- Funehag J, Thorn J. 2018. Radial penetration of cementitious grout − laboratory verification of grout spread in a fracture model. Tunn Undergr Space Technol 72: 228–232. [CrossRef] [Google Scholar]
- Geier S, Winkler C, Piesche M. 2009. Numerical simulation of mold filling processes with polyurethane foams. Chem Eng Technol 32: 1438–47. [CrossRef] [Google Scholar]
- Guo CC, Wang FM. 2012. Mechanism study on the construction of ultra-thin antiseepage wall by polymer injection. J Mater Civil Eng 24: 1183–1192. [CrossRef] [Google Scholar]
- Gustafson G, Claesson J, Fransson A. 2013. Steering parameters for rock grouting. J Appl Math 2013: 1–9. [CrossRef] [Google Scholar]
- Gustafson G, Stille H. 2005. Stop criteria for cement grouting. Felsbau: Zeitschrift für ̈1r Geomechanik und Ingenieurgeologie im Bauwesen und Bergbau 25: 62–68. [Google Scholar]
- Hao M, Wang F, Li X, Zhang B, Zhong Y. 2018. Numerical and experimental studies of diffusion law of grouting with expandable polymer. J Mater Civil Eng 30. https://doi.org/10.1061/(asce)mt.1943-5533.0002110 [Google Scholar]
- Hao M, Li X, Wang X, et al., 2021. Experimental study on viscosity characteristics of expanding polymer grout. J Wuhan Univ Technol-Mater Sci Ed 36. https://doi.org/10.1007/s11595-021-2409-7 [Google Scholar]
- Karimi M, Droghetti H, Marchisio DL. 2016. Multiscale modeling of expanding polyurethane foams via computational fluid dynamics and population balance equation. Macromol Symp 360: 108–22. [CrossRef] [Google Scholar]
- Karimi M, Droghetti H, Marchisio DL. 2017. PUFoam: A novel open-source CFD solver for the simulation of polyurethane foams. Comput Phys Commun 217: 138–148. [CrossRef] [Google Scholar]
- Li X, Hao M, Zhong Y, Zhang B, Wang F, Wang L. 2021. Experimental study on the diffusion characteristics of polyurethane grout in a fracture. Constr Build Mater 273: 121711. [CrossRef] [Google Scholar]
- Li X, Wang L, Hao M, Zhong Y, Zhang B. 2019. An analytical solution for the radial flow of variable density grout in rock fractures. Constr Build Mater 206: 630–640. [CrossRef] [Google Scholar]
- Liang J, Du X, et al., 2022. Numerical and experimental study of diffusion law of foamed polymer grout in fracture considering viscosity variation of slurry. Tunn Undergr Space Technol 128. [Google Scholar]
- Lu ZX, Li HX, Tian CJ. 1994. Determination of cell structure properties of polyurethane foam. Polym Mater Sci Eng 8: 452–456. [Google Scholar]
- Mitani T, Hamada H. 2003. Prediction of flow patterns in the polyurethane foaming process by numerical simulation considering foam expansion. Polym Eng Sci 43: 1603–1612. [CrossRef] [Google Scholar]
- Niedziela D, Ireka IE, Steiner K. 2019. Computational analysis of nonuniform expansion in polyurethane foams. Polym 11: 100. [CrossRef] [Google Scholar]
- Naudts A. 2003. Irreversible changes in the grouting industry caused by polyurethane grouting: an overview of 30 years of polyurethane grouting, Proc. of the deep ionstitute foundation conderence, New Orleans, Feb. 2003, 17p. https://doi.org/10.1061/40663(2003)74. [Google Scholar]
- Rafi J, Stille H. 2021. A method for determining grouting pressure and stop criteria to control grout spread distance and fracture dilation. Tunnel Undergr Space Technol 112: 103885. [CrossRef] [Google Scholar]
- Rana N, Nair R. 2016. Performance of polyurethane grouting to handle heavy seepage in tunnels, Recent Advances in Rock Engineering (RARE 2016), 8p. [Google Scholar]
- Rao R, Mondy L, Noble D, et al., 2018. Density predictions using a finite element/level set model of polyurethane foam expansion and polymerization. Comput Fluids 175: 20–35. [CrossRef] [Google Scholar]
- Seo D, Youn JR, Tucker CL. 2003. Numerical simulation of mold filling in foam reaction injection molding. Int J Numer Methods Fluids 42: 1105–1134. [CrossRef] [Google Scholar]
- Shi MS. 2011. Research on polymer grouting material properties and directional fracturing grouting mechanism for dykes and dams, Ph.D. thesis, Dalian Univ. of Technology, Dalian ( in Chinese). [Google Scholar]
- Sögaard C, Funehag J, Abbas Z. 2018. Silica sol as grouting material: a physio-chemical analysis. Nano Converg 5: 6. [CrossRef] [Google Scholar]
- Steele MC. 2003. The power of categorical goodness-of-fit statistics, Thesis, Qld: Griffith Universtity, 182p. [Google Scholar]
- Stille H, Gustafson G, Hassler L. 2012. Application of new theories and technology for grouting of dams and foundations on rock. Geotech Geol Eng 30: 603–624. [CrossRef] [Google Scholar]
- Wang C, Diao Y, Guo C, Li P, Du X, Pan Y. 2022. Two-stage column-hemispherical penetration diffusion model considering porosity tortuosity and time-dependent viscosity behavior. Acta Geotech. DOI: https://doi.org/10.1007/s11440-022-01754-8 [Google Scholar]
- Wang L. 2020. Study on the diffusion characteristics of polymer in the vertical fractures of the pisha-sandstone, Master thesis, Zhengzhou: Zhengzhou University, pp: 38–39. [Google Scholar]
- Wei Y, Wang F, Gao X, Zhong Y. 2017. Microstructure and fatigue performance of polyurethane grout materials under compression. J Mater Civil Eng 29. https://doi.10.1061/(ASCE)MT 1943-5533.0001954 [Google Scholar]
- Zhang WJ, Li SC, Wei JC, et al., 2018. Grouting rock fractures with cement and sodium silicate grout. Carbonates Evaporites 33: 211–222. [CrossRef] [Google Scholar]
- Zou L, Håkansson U, Cvetkovic V. 2020. Analysis of Bingham fluid radial flow in smooth fractures. J Rock Mech Geotech Eng 12: 1112–1118. [CrossRef] [Google Scholar]
Cite this article as: Meimei Hao, Mohamed El Tani, Xiaolong Li. Analytical solution for expandable polyurethane grouting in a rock fracture. Rev. Fr. Geotech. 2023, 174, 4.
All Tables
All Figures
|
Fig. 1 Schematic diagram of polyurethane grouting with a radial flow. |
| In the text | |
|
Fig. 2 Measured and calculated spreads at the front. |
| In the text | |
|
Fig. 3 Comparison of pressure between analytical and experimental results. |
| In the text | |
|
Fig. 4 Comparison of pressure variations over time between analytical and experimental results. |
| In the text | |
|
Fig. 5 Regression analysis of the calculated and the measured pressures. |
| In the text | |
|
Fig. 6 Difference between the measured and calculated pressure. |
| In the text | |
|
Fig. 7 Histogram and normal distribution. |
| In the text | |
|
Fig. 8 A planar view of a continuous barrier with a target D that exceeds the mid-distance d between the injection holes. |
| In the text | |
Current usage metrics show cumulative count of Article Views (full-text article views including HTML views, PDF and ePub downloads, according to the available data) and Abstracts Views on Vision4Press platform.
Data correspond to usage on the plateform after 2015. The current usage metrics is available 48-96 hours after online publication and is updated daily on week days.
Initial download of the metrics may take a while.